
3D Scanning Market Report 2026
Global Outlook – By Type (Optical Scanner, Laser Scanner, Structured Light Scanner), By Offering (Hardware, Software, Services), By Application (Entertainment and Media, Aerospace and Defense, Healthcare, Civil and Architecture, Industrial Manufacturing, Other Applications) – Market Size, Trends, Strategies, and Forecast to 2030
3D Scanning Market Overview
• 3D Scanning market size has reached to $6.35 billion in 2025 • Expected to grow to $11.26 billion in 2030 at a compound annual growth rate (CAGR) of 12.2% • Growth Driver: Automotive Industry's Surge Fueling 3D Scanning Market Growth • Market Trend: Innovations in Professional 3D scanners for Enhanced Accuracy and Efficiency • North America was the largest region in 2025 and Asia-Pacific is the fastest growing region.Market Gains By 2030 – Top Opportunities By Segment
Market Gain identifies the most promising market opportunities by highlighting the segments or products expected to generate the highest incremental revenue growth over the next five years.
What Is Covered Under 3D Scanning Market?
3D scanning refers to imaging device technology that collects real-world object distance point measurements and converts them into a virtual 3-D object. The 3D scanning is used to create 3D models of real-world objects. 3D scanning provides users with highly accurate measurements and the ability to fully utilize, visualize, and modify data captured with a 3D scanner by taking multiple snapshots of an object. The purpose of 3D scanning is to imagine the end product nodes before the beginning of the manufacturing process. The main types of 3D scanning are optical scanners, laser scanners, and structured light scanners. An optical scanner refers to a computer input device that scans codes, text, or graphic images directly into a computer or computer system using a light beam. The different offerings include hardware, software, and services that include various applications such as entertainment and media, aerospace and defense, healthcare, civil and architecture, industrial manufacturing, and others.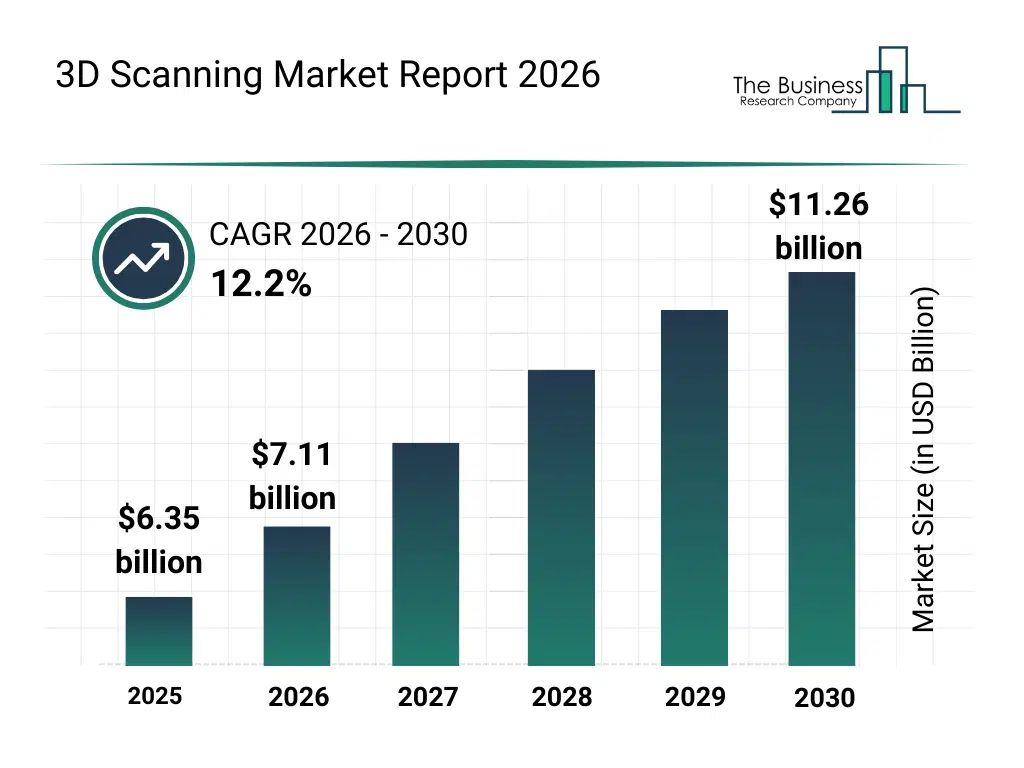
What Is The 3D Scanning Market Size and Share 2026?
The 3D scanning market size has grown rapidly in recent years. It will grow from $6.35 billion in 2025 to $7.11 billion in 2026 at a compound annual growth rate (CAGR) of 12.0%. The growth in the historic period can be attributed to manufacturing quality control needs, early optical scanning adoption, industrial automation growth, prototyping demand, cost reduction in sensors.What Is The 3D Scanning Market Growth Forecast?
The 3D scanning market size is expected to see rapid growth in the next few years. It will grow to $11.26 billion in 2030 at a compound annual growth rate (CAGR) of 12.2%. The growth in the forecast period can be attributed to smart factory adoption, aerospace inspection demand, digital manufacturing workflows, AI enhanced scanning analytics, portable scanner innovation. Major trends in the forecast period include high precision industrial scanning, reverse engineering applications, digital inspection systems, portable 3D scanners, real time data capture.
Global 3D Scanning Market Segmentation
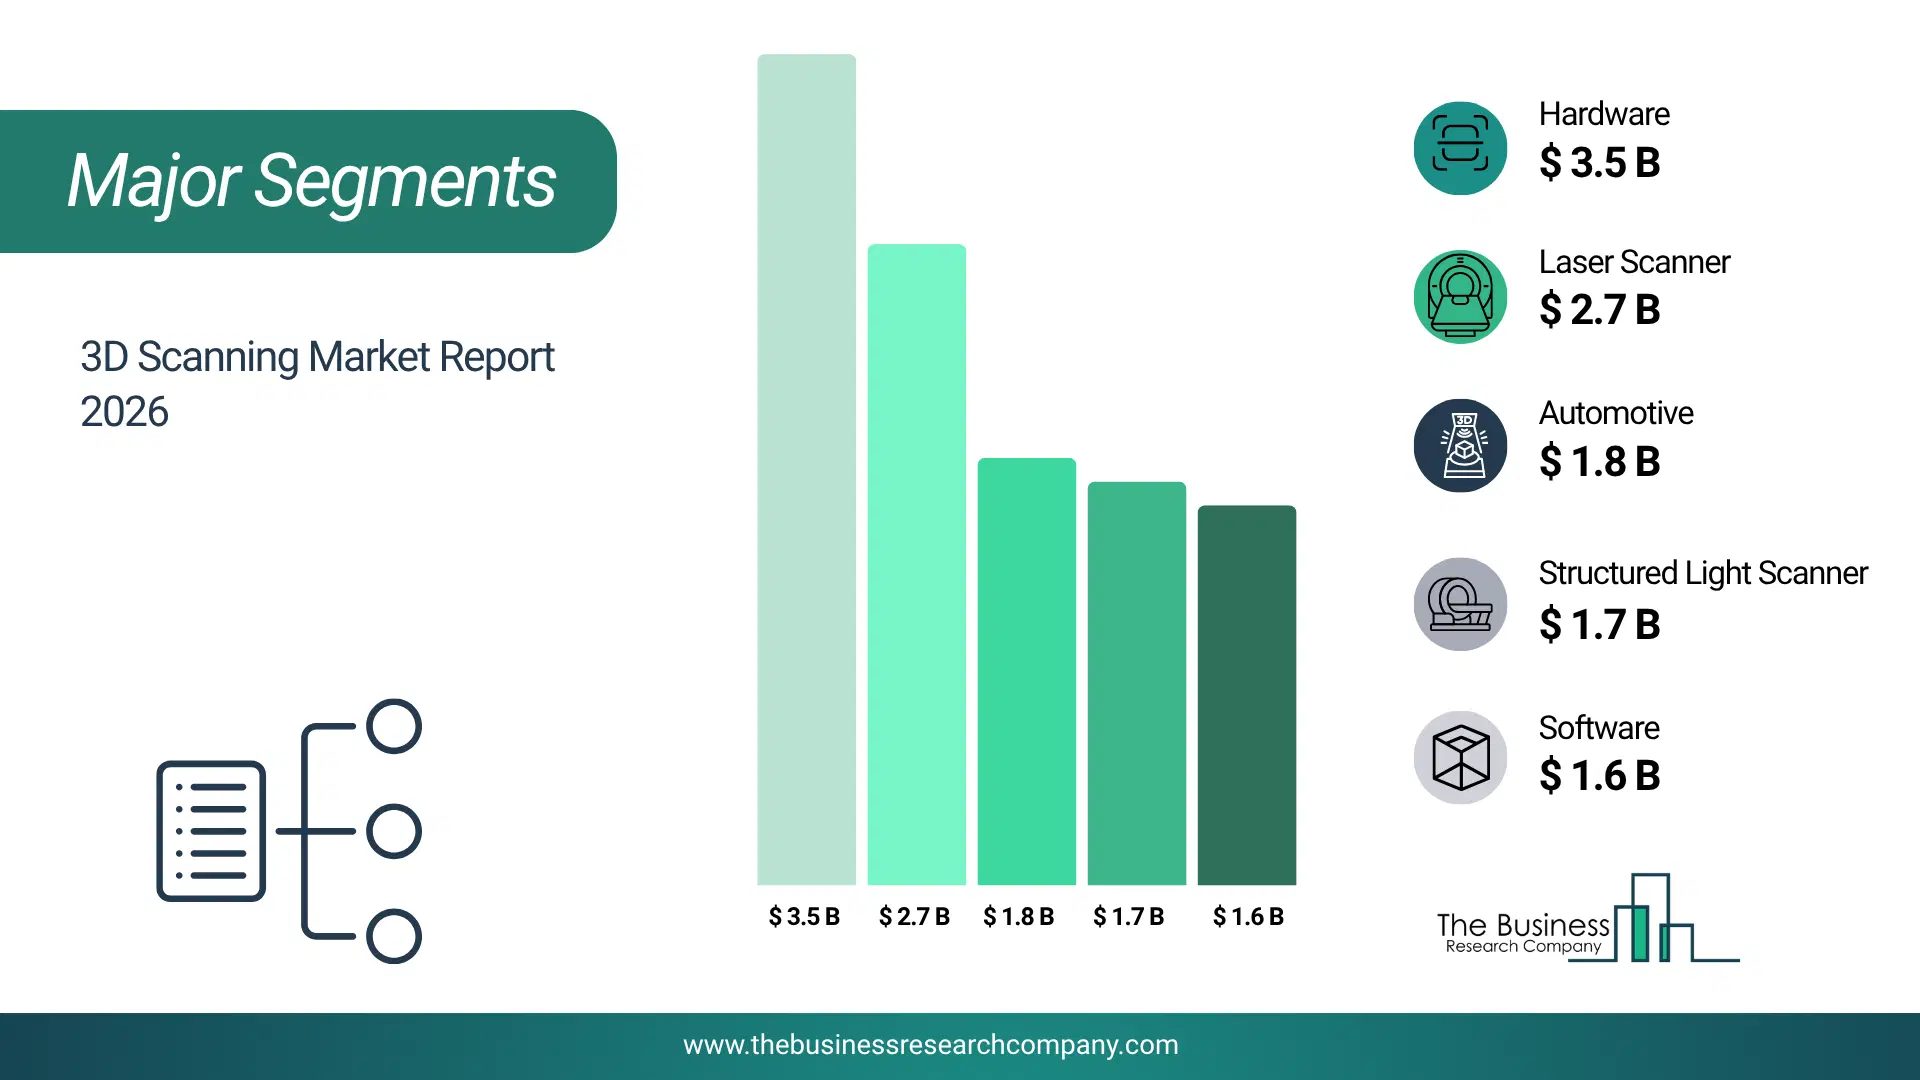
1) By Type: Optical Scanner, Laser Scanner, Structured Light Scanner 2) By Offering: Hardware, Software, Services 3) By Application: Entertainment and Media, Aerospace and Defense, Healthcare, Civil and Architecture, Industrial Manufacturing, Other Applications Subsegments: 1) By Optical Scanner: Handheld Optical Scanners, Fixed Optical Scanners 2) By Laser Scanner: Time-of-Flight Laser Scanners, Phase-Shift Laser Scanners 3) By Structured Light Scanner: Triangulation-Based Structured Light Scanners, Fringe Projection Scanners The top segments in the 3d scanning market will be: • Hardware will reach $3529 Million by 2025. • Laser Scanner will reach $2704.74 Million by 2025. • Automotive will reach $1861.37 Million by 2025. • Structured Light Scanner will reach $1709.81 Million by 2025. • Software will reach $1665.91 Million by 2025.What Is The Driver Of The 3D Scanning Market?
The rise in the automotive industry is expected to propel the growth of the 3D scanning market going forward. The automotive industry encompasses the production, design, development, and sale of vehicles, including cars, trucks, and motorcycles, along with associated parts and services. The automotive industry uses 3D scanning technology to create precise digital replicas of physical car components, facilitating design improvements, quality control, and prototyping processes. These scans assist in capturing complex geometries, aiding in the development of customized parts, and enhancing manufacturing efficiency. For instance, in December 2023, according to MarkLines Co. Ltd., a US-based provider of online information services to the automotive industry, the US new vehicle sales of 1,242,376 units for November 2023 represented an increase of 2.6% from October 2023 and an increase of 8.8% from November 2022. Therefore, a rise in the automotive industry will drive the growth of the 3D scanning industry.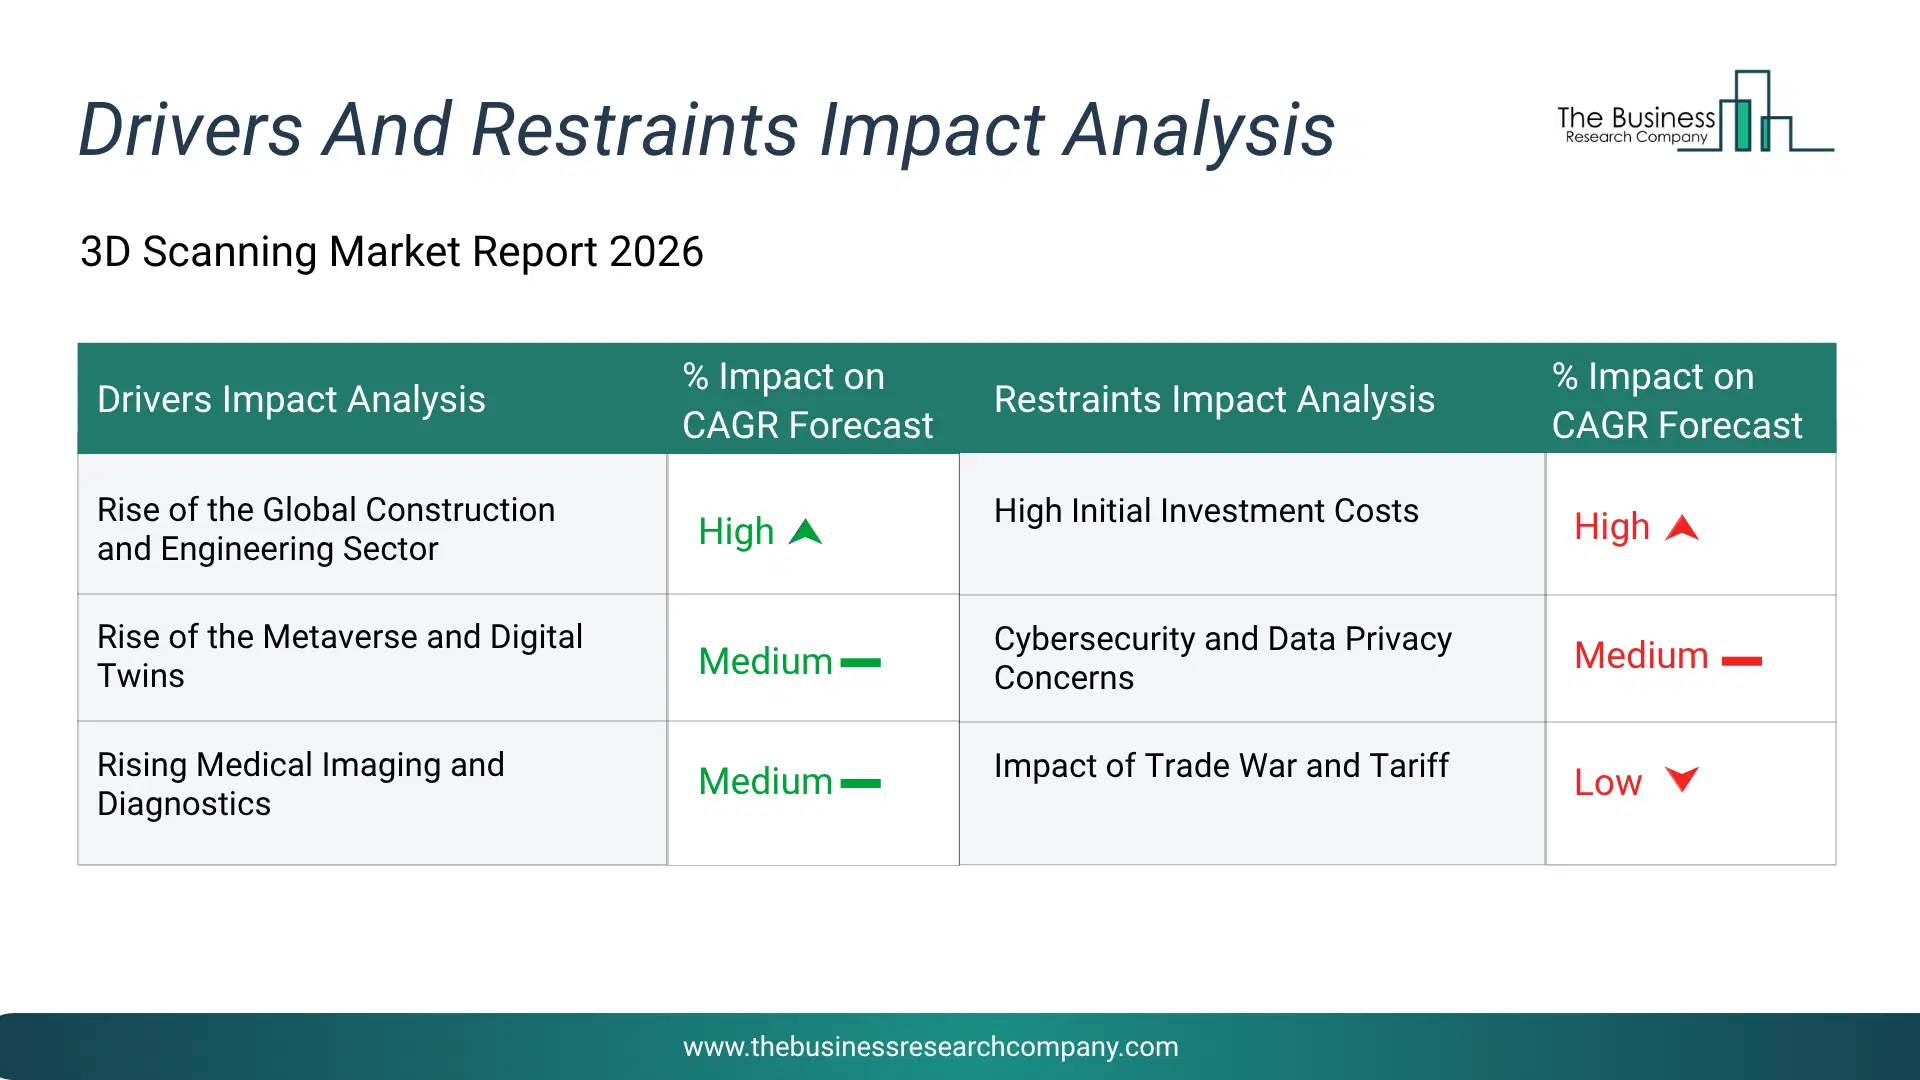
Infographic Chart Showing Key Market Drivers Analysis And Restraints For 3D Scanning Market
The chart presents an impact analysis of key drivers and restraints, quantifying their relative influence on the market's growth rate and helping assess the balance between growth enablers and limiting factors. This chart offers a high-level perspective; the full report contains more detailed insights.
How Will The Drivers Impact Growth In The Global 3D Scanning Market?
• Rise of the Global Construction and Engineering Sector (High) – The rise of the global construction and engineering sector will become a key driver of growth in the 3D scanning market by 2030. As urbanization accelerates and infrastructure projects become more complex, the demand for precise and efficient measurement technologies like 3D scanning is increasing. These technologies offer enhanced accuracy, reduced project timelines and improved safety, making them indispensable in modern construction practices. Notably, regions like Asia-Pacific are expected to lead this expansion due to rapid urban development and rising demand for smart, climate-resilient infrastructure. This surge in construction activities is anticipated to drive the adoption of 3D scanning technologies, as they play a crucial role in ensuring precision and efficiency in large-scale projects. Consequently, the 3D scanning market is poised for significant growth, aligning with the broader expansion of the global construction and engineering sector. As a result, the rise of the global construction and engineering sector is anticipated to contributing to a 2.0% annual growth in the market. • Rise of the Metaverse and Digital Twins (Medium) – The rise of the metaverse and the growing adoption of digital twin technologies will emerge as a major factor driving the expansion of the 3D scanning market by 2030. As industries across sectors such as architecture, engineering, manufacturing and urban planning embrace virtual environments, the demand for precise and high-quality 3D models is increasing. 3D scanning technologies enable the accurate capture of real-world assets and environments, facilitating the creation of detailed digital twins that improve planning, simulation and operational efficiency. Moreover, 3D scanning allows for faster and more reliable model generation, reducing errors and enhancing decision-making in digital twin applications. As organizations continue to adopt immersive technologies and integrate digital twins into their workflows, the utilization of 3D scanning is expected to rise significantly, thereby driving the growth of the 3D scanning market. Consequently, the rise of the metaverse and the growing adoption of digital twin technologies is projected to contributing to a 1.5% annual growth in the market. • Rising Medical Imaging and Diagnostics (Medium) – The growth of medical imaging and diagnostics will serve as a key growth catalyst for the 3D scanning market by 2030. As healthcare providers increasingly seek accurate, non-invasive and efficient diagnostic tools, the demand for advanced 3D imaging technologies is rising. 3D scanning enables detailed visualization and precise measurements, supporting applications in oncology, orthopaedics, neurology and other medical fields. Moreover, these technologies enhance diagnostic accuracy, reduce the need for invasive procedures and streamline patient care workflows. As healthcare facilities continue to adopt advanced imaging solutions and expand diagnostic capabilities, the integration of 3D scanning is expected to increase significantly, thereby driving the growth of the 3D scanning market. Therefore, this growth of medical imaging and diagnostics is projected to supporting to a 1.0% annual growth in the market. • Growth of the Entertainment & Media Industry (Low) – The growth of the entertainment and media industry will become a significant driver contributing to the growth of the 3D scanning market by 2030. As digital content creation, animation, gaming and visual effects continue to expand, there is an increasing demand for precise and high-quality 3D scanning technologies. 3D scanning enables the creation of realistic models, immersive experiences and accurate visual effects, supporting film, gaming and animation production. Moreover, the ability to quickly capture detailed 3D assets allows studios and content creators to reduce production time and improve creative flexibility. As the entertainment and media industry continues to grow and adopt advanced digital technologies, the utilization of 3D scanning is expected to rise significantly, thereby driving the growth of the 3D scanning market. Consequently, the growth of the entertainment and media industry strategies is projected to contributing to a 0.5% annual growth in the market.How Will The Restraints Impact Growth In The Global 3D Scanning Market?
• High Initial Investment Costs (Medium) – High Initial Investment Costs will restrict the growth of the 3D Scanning market during the forecast period. 3D scanning equipment involves significant capital investment for hardware, software, and training. High costs create barriers for smaller firms and independent professionals. Investment requirements can limit 3D scanning adoption and affect market growth in price-sensitive segments. • Cybersecurity and Data Privacy Concerns (Medium) – Cybersecurity and Data Privacy Concerns will restrict the growth of the 3D Scanning market during the forecast period. 3D scanning generates detailed data that can raise privacy and security concerns. The collection and storage of 3D data create risks of unauthorized access and misuse. Data privacy and security concerns can affect adoption in certain applications and industries, limiting market growth. • Impact of Trade War and Tariff (Low) – Impact of Trade War and Tariff will restrict the growth of the 3D Scanning market during the forecast period. 3D scanning equipment relies on imported sensors, optics, and electronic components subject to trade tariffs. Trade barriers can increase equipment costs and affect availability. Trade tensions may also impact industrial and construction activity, affecting scanning demand.Key Players In The Global 3D Scanning Market
Major companies operating in the 3D scanning market are Carl Zeiss AG; Konica Minolta Inc.; Hexagon AB; Autodesk Inc.; Nikon Corporation; Trimble Inc.; Topcon Corporation; Jenoptik AG; 3D Systems Corporation; FARO Technologies Inc.; Mimetrik Solutions Limited; Maptek Pty Ltd.; Creaform Inc.; CyberOptics Corporation; Blickfeld GmbH; Artec 3D; Scantech International Pty Ltd.; InspecVision Ltd.; Skycatch Inc.; ScanLAB Projects Ltd.; 3D Digital Corporation; ShapeGrabber Inc.; Imerso AS; OR3D Ltd.; Astrivis Ltd.; Direct Dimensions Inc.; GOM GmbH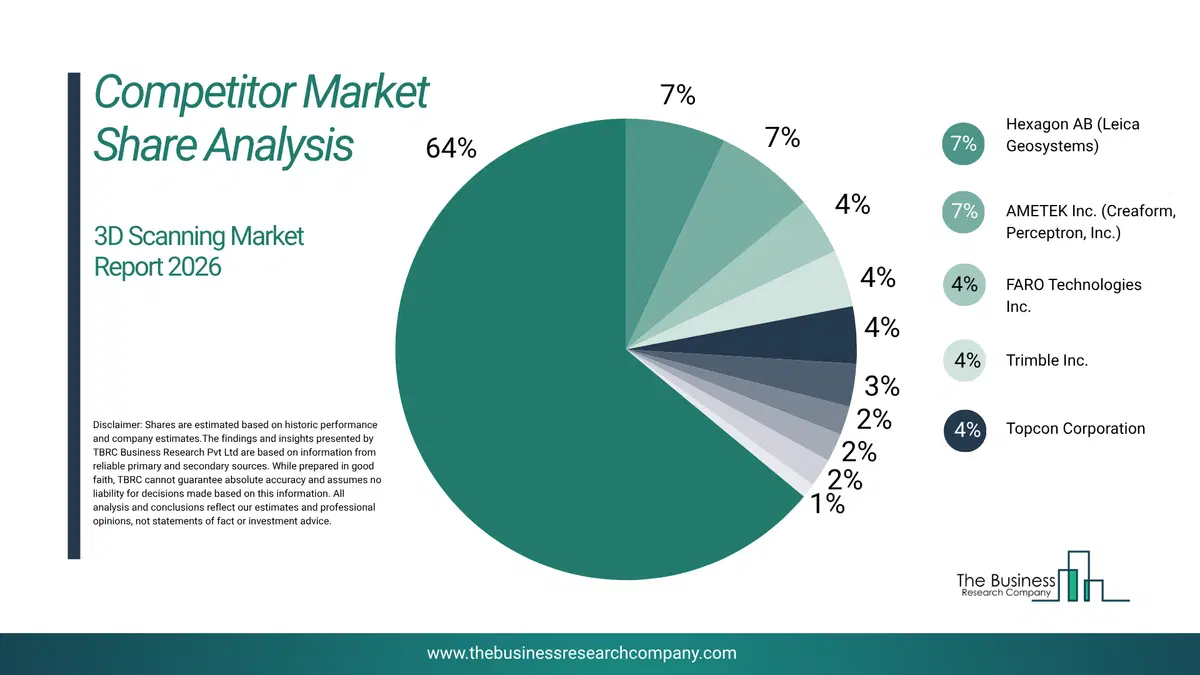
This chart is for illustrative purposes; the full report includes a detailed competitor analysis and comprehensive overview of the top 10 companies in the market.
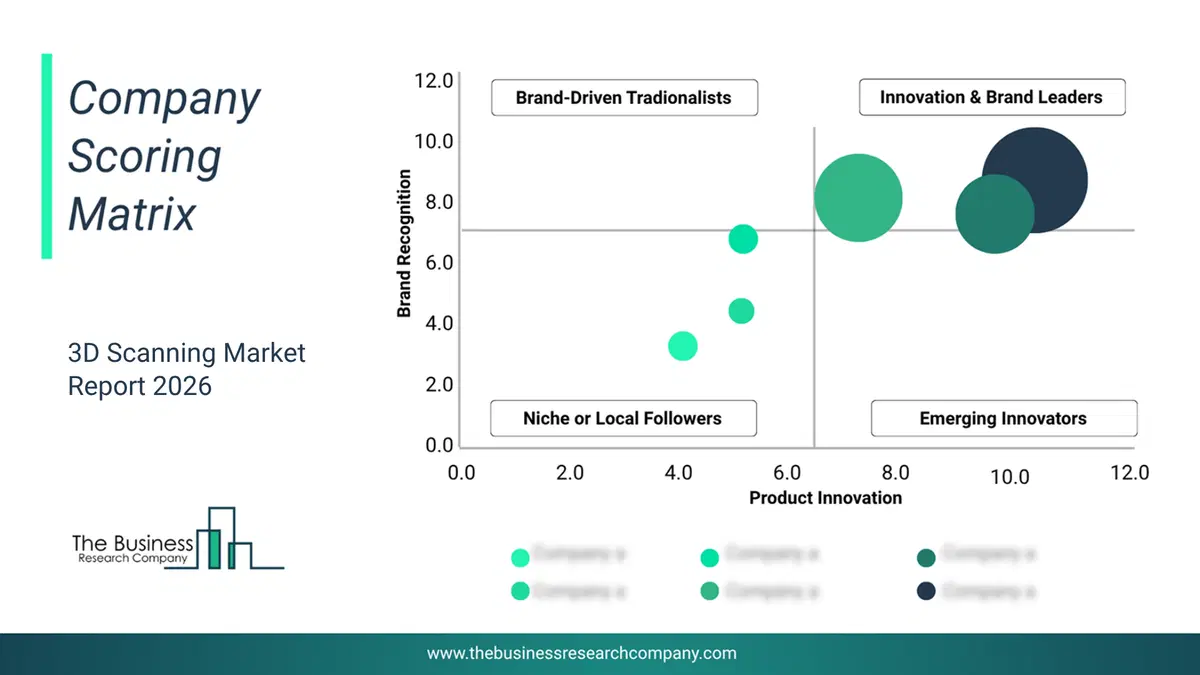
This chart maps companies by product innovation and brand strength, with bubble size indicating relative revenue, helping identify market leaders, challengers, and niche players. This is an illustrative chart; the full report provides a complete and accurate competitive analysis.
Global 3D Scanning Market Trends and Insights
Major companies operating in the 3D scanning market are prioritizing the introduction of advanced products such as professional 3D Scanners to improve accuracy and speed. Professional 3D scanners refer to advanced devices designed to capture the precise shape and appearance of physical objects, creating detailed three-dimensional digital models for applications in industries such as manufacturing, engineering, architecture, and healthcare. For instance, in October 2024, Revopoint, a China based company specializing in the development of 3D scanning technology, launched MetroX 3D Scanner designed for professional use. The MetroX combines crossline lasers and full-field structured light scanning, capturing up to 7 million points per second. With an impressive accuracy of 0.03 mm, the scanner offers high precision for industries such as metrology, rapid prototyping, and product design. The MetroX stands out for its affordability and user-friendly interface, making advanced scanning accessible to a wider range of professionals.What Are Latest Mergers And Acquisitions In The 3D Scanning Market?
In March 2023, Snap Inc., a US-based social media and camera company, acquired Th3rd for an undisclosed amount. With this acquisition, Snap aims to significantly enhance its augmented reality and 3D content capabilities, enabling more immersive and interactive experiences for users and advertisers while expanding its metaverse, digital twin offerings, and AI-driven personalization features. Th3rd, a Netherlands-based 3D-scanning studio that offers 3D scanning services.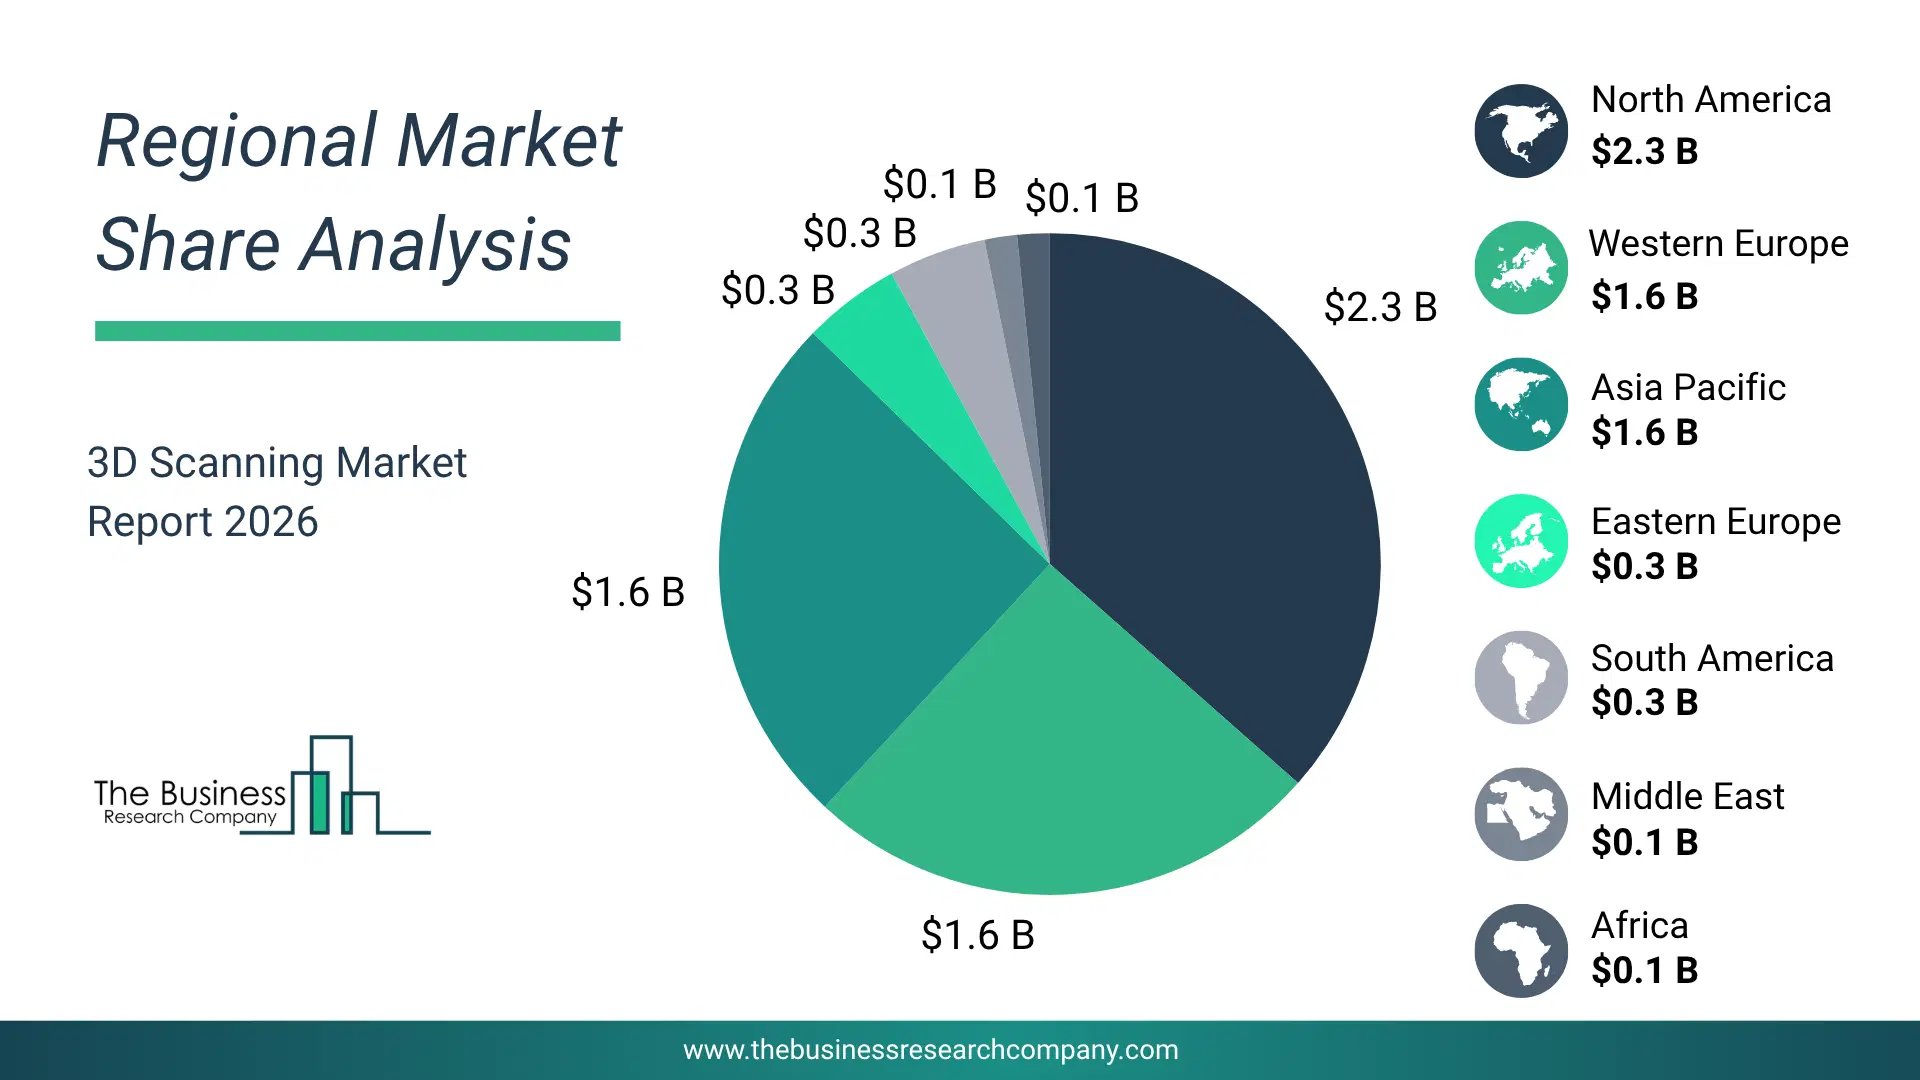
Regional Insights
North America was the largest region in the 3D scanning market in 2025. Asia-Pacific is expected to be the fastest-growing region in the forecast period. The regions covered in this market report are Asia-Pacific, South East Asia, Western Europe, Eastern Europe, North America, South America, Middle East, Africa. The countries covered in this market report are Australia, Brazil, China, France, Germany, India, Indonesia, Japan, Taiwan, Russia, South Korea, UK, USA, Canada, Italy, SpainWhat Defines the 3D Scanning Market?
The 3D scanning market consists of revenues earned by entities by providing photogrammetry and laser-based 3D scanner. Values in this market are ‘factory gate’ values, that is the value of goods sold by the manufacturers or creators of the goods, whether to other entities (including downstream manufacturers, wholesalers, distributors, and retailers) or directly to end customers. The value of goods in this market includes related services sold by the creators of the goods.How is Market Value Defined and Measured?
The market value is defined as the revenues that enterprises gain from the sale of goods and/or services within the specified market and geography through sales, grants, or donations in terms of the currency (in USD unless otherwise specified). The revenues for a specified geography are consumption values that are revenues generated by organizations in the specified geography within the market, irrespective of where they are produced. It does not include revenues from resales along the supply chain, either further along the supply chain or as part of other products.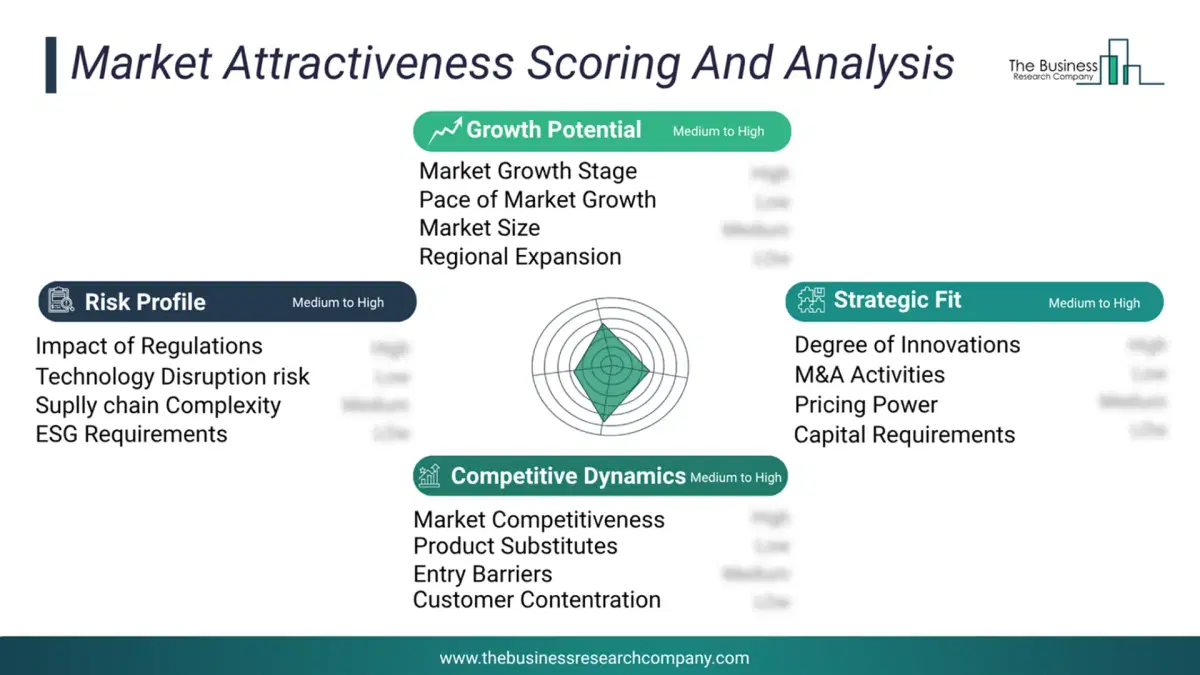
This chart presents market attractiveness based on a quantitative evaluation of growth, competition, strategic alignment, and risk, offering a clear view of opportunity areas for decision-making. This chart is for illustrative purposes; the full report contains the complete analysis.
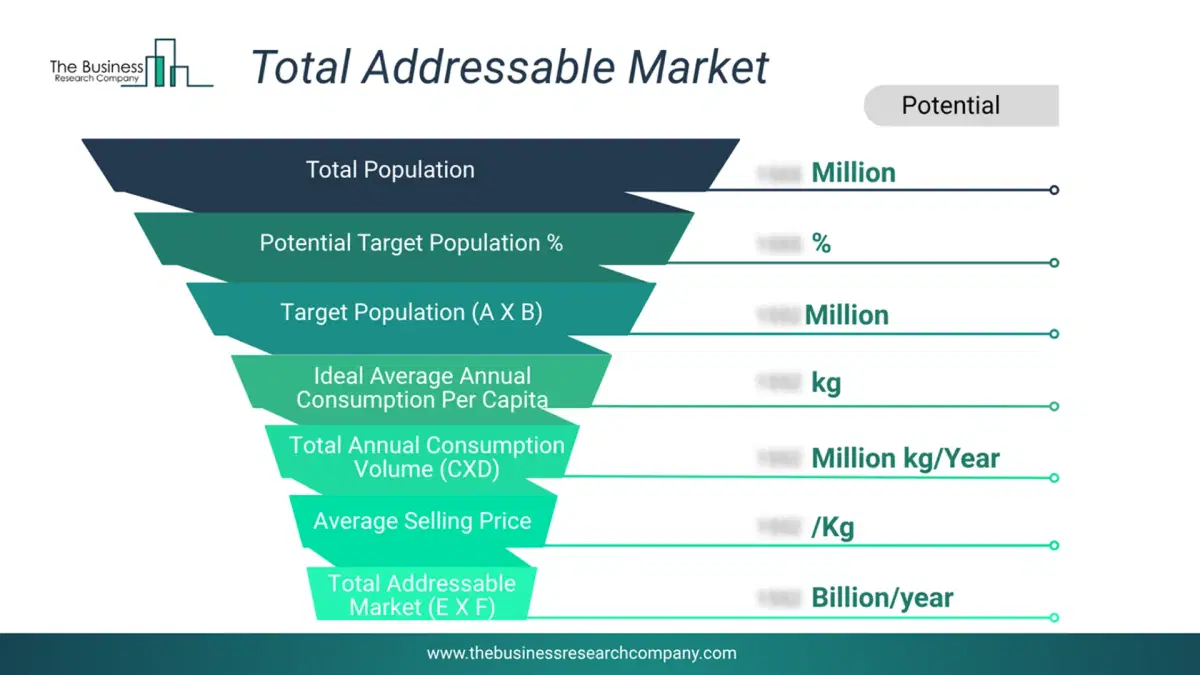
This chart highlights the Total Addressable Market (TAM) by estimating the maximum revenue opportunity using an assumption-driven approach, supporting strategic planning and opportunity sizing across markets. The chart is illustrative; the full report provides a more comprehensive analysis.
What Key Data and Analysis Are Included in the 3D Scanning Market Report 2026?
The 3d scanning market research report is one of a series of new reports from The Business Research Company that provides market statistics, including industry global market size, regional shares, competitors with the market share, detailed market segments, market trends and opportunities, and any further data you may need to thrive in the 3d scanning industry. The market research report delivers a complete perspective of everything you need, with an in-depth analysis of the current and future state of the industry.3D Scanning Market Report Forecast Analysis
| Report Attribute | Details |
|---|---|
| Market Size Value In 2026 | $7.11 billion |
| Revenue Forecast In 2030 | $11.26 billion |
| Growth Rate | CAGR of 12.0% from 2026 to 2030 |
| Base Year For Estimation | 2025 |
| Actual Estimates/Historical Data | 2020-2025 |
| Forecast Period | 2026 - 2030 |
| Market Representation | Revenue in USD Billion and CAGR from 2026 to 2030 |
| Segments Covered | Type, Offering, Application |
| Regional Scope | Asia-Pacific, Western Europe, Eastern Europe, North America, South America, Middle East, Africa |
| Country Scope | The countries covered in the report are Australia, Brazil, China, France, Germany, India, Indonesia, Japan, Taiwan, Russia, South Korea, UK, USA, Canada, Italy, Spain. |
| Key Companies Profiled | Carl Zeiss AG; Konica Minolta Inc.; Hexagon AB; Autodesk Inc.; Nikon Corporation; Trimble Inc.; Topcon Corporation; Jenoptik AG; 3D Systems Corporation; FARO Technologies Inc.; Mimetrik Solutions Limited; Maptek Pty Ltd.; Creaform Inc.; CyberOptics Corporation; Blickfeld GmbH; Artec 3D; Scantech International Pty Ltd.; InspecVision Ltd.; Skycatch Inc.; ScanLAB Projects Ltd.; 3D Digital Corporation; ShapeGrabber Inc.; Imerso AS; OR3D Ltd.; Astrivis Ltd.; Direct Dimensions Inc.; GOM GmbH |
| Customization Scope | Request for Customization |
| Pricing And Purchase Options | Explore Purchase Options |