
Reverse Logistics Market Report 2026
Global Outlook – By Return Type (Recalls; Commercial Returns; Repairable Returns; End-Of-Use Returns; End Of Life Returns ), By Service (Transportation; Warehousing; Reselling; Replacement Management; Refund Management Authorization; Other Services), By End User (E-Commerce; Automotive; Pharmaceutical; Consumer Electronic; Retail; Luxury Goods; Reusable Packaging) – Market Size, Trends, Strategies, and Forecast to 2030
Reverse Logistics Market Overview
• Reverse Logistics market size has reached to $773.4 billion in 2025 • Expected to grow to $1041.46 billion in 2030 at a compound annual growth rate (CAGR) of 6.1% • Growth Driver: Growth of E-commerce and Reverse Logistics • Market Trend: Innovative UPS Pickup Point Locations Transforming Healthcare Reverse Logistics • Asia-Pacific was the largest region in 2025.Market Gains By 2030 – Top Opportunities By Segment
Market Gain identifies the most promising market opportunities by highlighting the segments or products expected to generate the highest incremental revenue growth over the next five years.
What Is Covered Under Reverse Logistics Market?
Reverse logistics refers to the process of moving goods from their destination back to the manufacturer or another point in the supply chain for various purposes. It helps organizations recover value from returned products, minimize environmental impact, and improve overall operational efficiency. The main types of returns in reverse logistics are recalls, commercial returns, repairable returns, end-of-use returns, and end-of-life returns. A recall is referred to as a call to return or a request for the return of a product, typically due to a defect or contamination issue. The services provided by this are transportation, warehousing, reselling, replacement management, refund management authorization, and others, and end-users include e-commerce, automotive, pharmaceutical, consumer electronics, retail, luxury goods, and reusable packaging.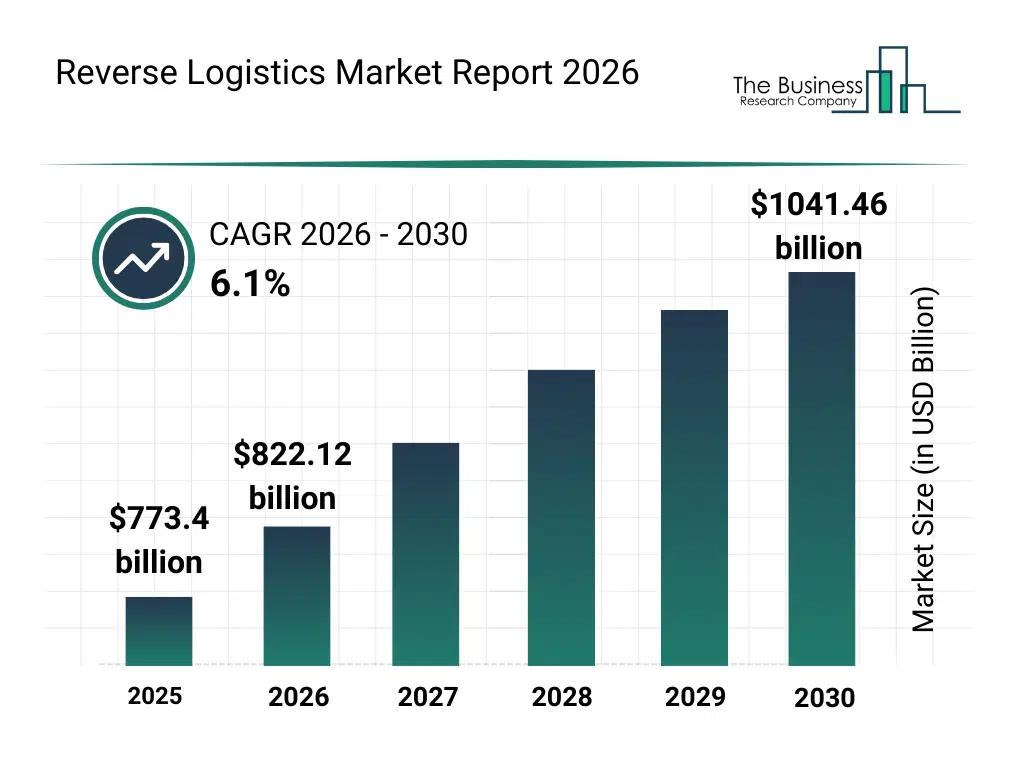
What Is The Reverse Logistics Market Size and Share 2026?
The reverse logistics market size has grown strongly in recent years. It will grow from $773.4 billion in 2025 to $822.12 billion in 2026 at a compound annual growth rate (CAGR) of 6.3%. The growth in the historic period can be attributed to expansion of e-commerce activities, rising product return volumes, increased emphasis on warranty and recall management, growth in retail and consumer electronics sales, development of centralized logistics networks.What Is The Reverse Logistics Market Growth Forecast?
The reverse logistics market size is expected to see strong growth in the next few years. It will grow to $1041.46 billion in 2030 at a compound annual growth rate (CAGR) of 6.1%. The growth in the forecast period can be attributed to increasing focus on circular economy practices, rising investments in automated reverse logistics facilities, expansion of recycling and reuse programs, growing regulatory focus on waste reduction, increasing integration of ai-driven return analytics. Major trends in the forecast period include increasing adoption of structured return management systems, growing integration of digital return tracking platforms, expansion of repair and refurbishment operations, rising focus on value recovery from returned goods, enhanced optimization of reverse supply chains.
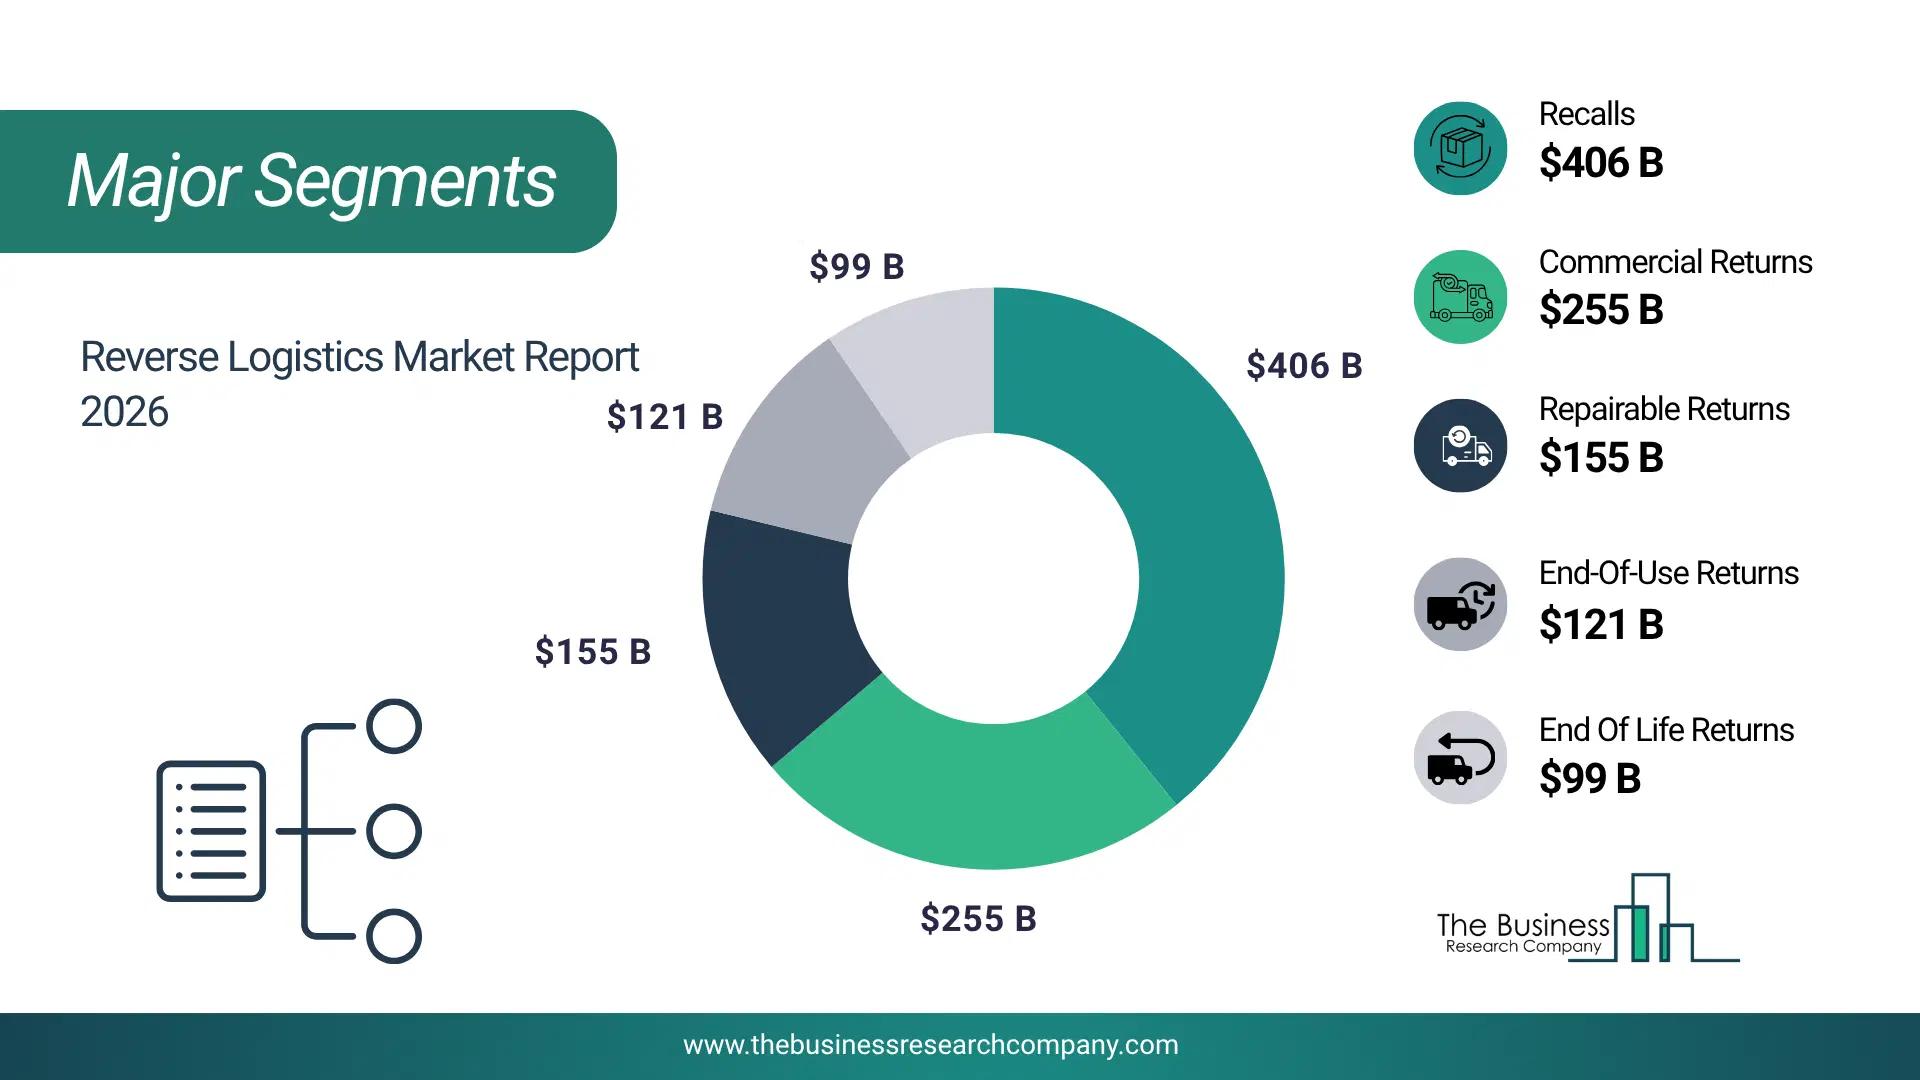
Global Reverse Logistics Market Segmentation
1) By Return Type: Recalls, Commercial Returns, Repairable Returns, End-Of-Use Returns, End Of Life Returns 2) By Service: Transportation, Warehousing, Reselling, Replacement Management, Refund Management Authorization, Other Services 3) By End User: E-Commerce, Automotive, Pharmaceutical, Consumer Electronic, Retail, Luxury Goods, Reusable Packaging Subsegments: 1) By Recalls: Product Safety Recalls, Regulatory Recalls, Voluntary Recalls, Mandatory Recalls 2) By Commercial Returns: Customer-Initiated Returns, Retail Returns, Warranty Returns, Promotional Returns 3) By Repairable Returns: Defective Product Returns, Refurbishment Returns, Component Repair Returns, Manufacturer Repair Returns 4) By End-Of-Use Returns: Product Trade-In Returns, Upgrade Returns, Leasing Returns, Subscription-End Returns 5) By End-Of-Life Returns: Disposal Returns, Recycling Returns, Scrapping Returns, E-Waste Returns The top segments in the reverse logistics market will be: • Recalls will reach $405.57 Billion by 2030. • Commercial Returns will reach $255.21 Billion by 2030. • Repairable Returns will reach $154.69 Billion by 2030. • End-Of-Use Returns will reach $120.84 Billion by 2030. • End Of Life Returns will reach $99.34 Billion by 2030.What Is The Driver Of The Reverse Logistics Market?
The rapid growth of e-commerce is expected to propel the growth of the reverse logistics market going forward. E-commerce, or electronic commerce, refers to the buying and selling of goods and services over the Internet. Reverse logistics is used in e-commerce to manage the flow of returned products from customers back to the original point of origin, such as the warehouse or store, which helps to maintain customer trust, minimize losses, and contribute to sustainable business practices. For instance, in November 2023, according to the United States Census Bureau, a US-based government agency, e-commerce increased and reached the 3rd quarter of 2023 at 7.6%, compared to the 4th quarter of 2022 by 6.9%. 15.4% of all sales in the second quarter of 2023 were made through online stores. Therefore, the growth of e-commerce is driving the growth of the reverse logistics industry.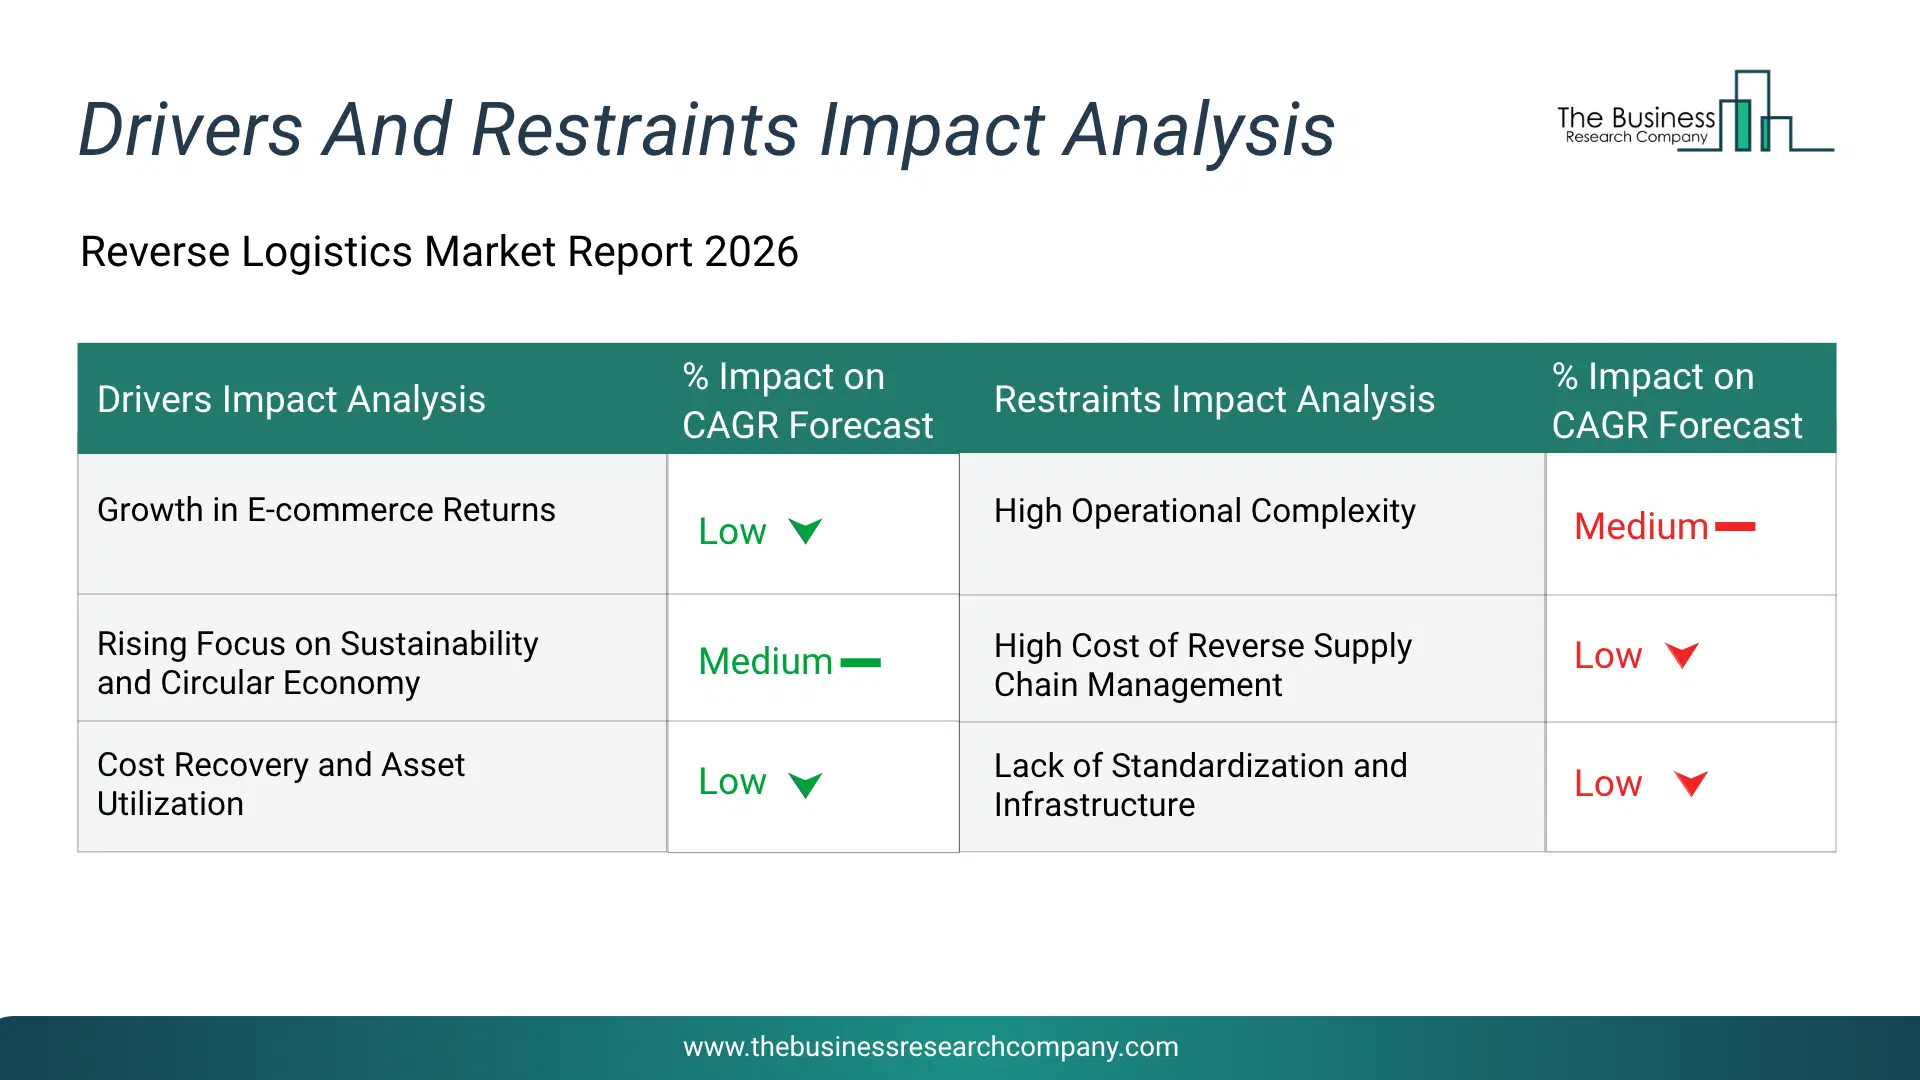
Infographic Chart Showing Key Market Drivers Analysis And Restraints For Reverse Logistics Market
The chart presents an impact analysis of key drivers and restraints, quantifying their relative influence on the market's growth rate and helping assess the balance between growth enablers and limiting factors. This chart offers a high-level perspective; the full report contains more detailed insights.
How Will The Drivers Impact Growth In The Global Reverse Logistics Market?
• Growth in E-commerce Returns (Low) – During the forecast period, the growth in e-commerce returns is expected to become a key growth driver for the reverse logistics market by 2030. The expansion of online shopping has significantly increased product return volumes, creating a strong need for efficient reverse logistics systems. High return rates due to product mismatch or customer dissatisfaction require streamlined processes for collection, inspection, and redistribution. Businesses adopt reverse logistics to maintain customer satisfaction and manage operational efficiency. It also supports faster turnaround times and reduces losses from returned goods. As e-commerce continues to grow, reverse logistics becomes essential for handling post-sale product flows. This directly drives demand for advanced return management solutions. • Rising Focus on Sustainability and Circular Economy (Medium) – During the forecast period, the rising focus on sustainability and circular economy is expected to emerge as a major factor driving the expansion of the reverse logistics market by 2030. Increasing environmental concerns and regulatory pressure are pushing companies to adopt sustainable practices. Reverse logistics enables recycling, refurbishing, and reuse of products, reducing waste generation. It supports circular economy models by extending product lifecycles and minimizing resource consumption. Companies benefit from improved brand image and compliance with environmental standards. Governments are also promoting sustainable logistics through policies and incentives. As sustainability becomes a strategic priority, reverse logistics adoption continues to rise. • Cost Recovery and Asset Utilization (Low) – During the forecast period, the cost recovery and asset utilization is expected to act as a key growth catalyst for the reverse logistics market by 2030. Reverse logistics helps organizations recover value from returned or unsold products through refurbishment and resale. Instead of incurring losses, businesses can generate additional revenue streams. It improves inventory management by reintroducing usable goods into the supply chain. Companies also reduce disposal costs and optimize resource utilization. Efficient reverse logistics enhances profitability and operational performance. As businesses focus on margin improvement, the importance of cost recovery mechanisms increases significantly.How Will The Restraints Impact Growth In The Global Reverse Logistics Market?
• High Operational Complexity (Low) – During the forecast period, high operational complexity is significantly restricting the growth of the reverse logistics market. The need to manage diverse return flows, product conditions, inspection processes, and multi-channel coordination is increasing operational challenges and reducing process efficiency across the supply chain. • High Cost of Reverse Supply Chain Management (Medium) – During the forecast period, high cost of reverse supply chain management is significantly restricting the growth of the reverse logistics market. Expenses related to transportation, warehousing, sorting, refurbishment, and disposal of returned goods are increasing overall operational costs and limiting profitability for logistics providers. • Lack of Standardization and Infrastructure (Low) – During the forecast period, lack of standardization and infrastructure is significantly restricting the growth of the reverse logistics market. Absence of uniform return policies, fragmented logistics systems, and inadequate recycling and refurbishment infrastructure are hindering efficient reverse flow management and limiting market scalability.Key Players In The Global Reverse Logistics Market
Major companies operating in the reverse logistics market are Deutsche Post DHL Group, United Parcel Service Inc., FedEx Corporation, Schenker AG, Kuehne + Nagel International AG, DSV Panalpina A/S, C.H. Robinson Worldwide, Dachser SE, Nippon Express Co. Ltd., Expeditors International of Washington Inc., J.B. Hunt Transport Services Inc., Ryder System Inc., Kerry Logistics Network Limited, XPO Logistics Inc, Landstar System Inc., Kintetsu World Express Inc., ArcBest Corporation, Zebra Technologies Corp, Hellmann Worldwide Logistics, Echo Global Logistics Inc., Yusen Logistics Co. Ltd., Agility Logistics, Safexpress Pvt. Ltd, CEVA Logistics AG, RLG Systems AG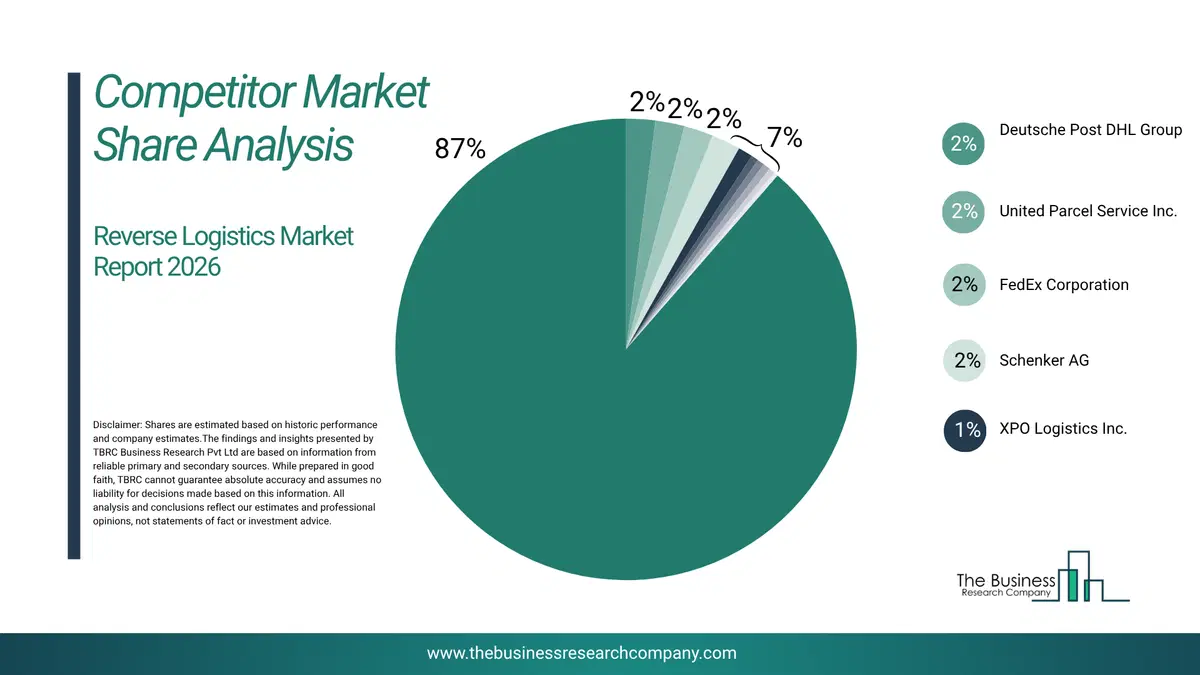
This chart is for illustrative purposes; the full report includes a detailed competitor analysis and comprehensive overview of the top 10 companies in the market.
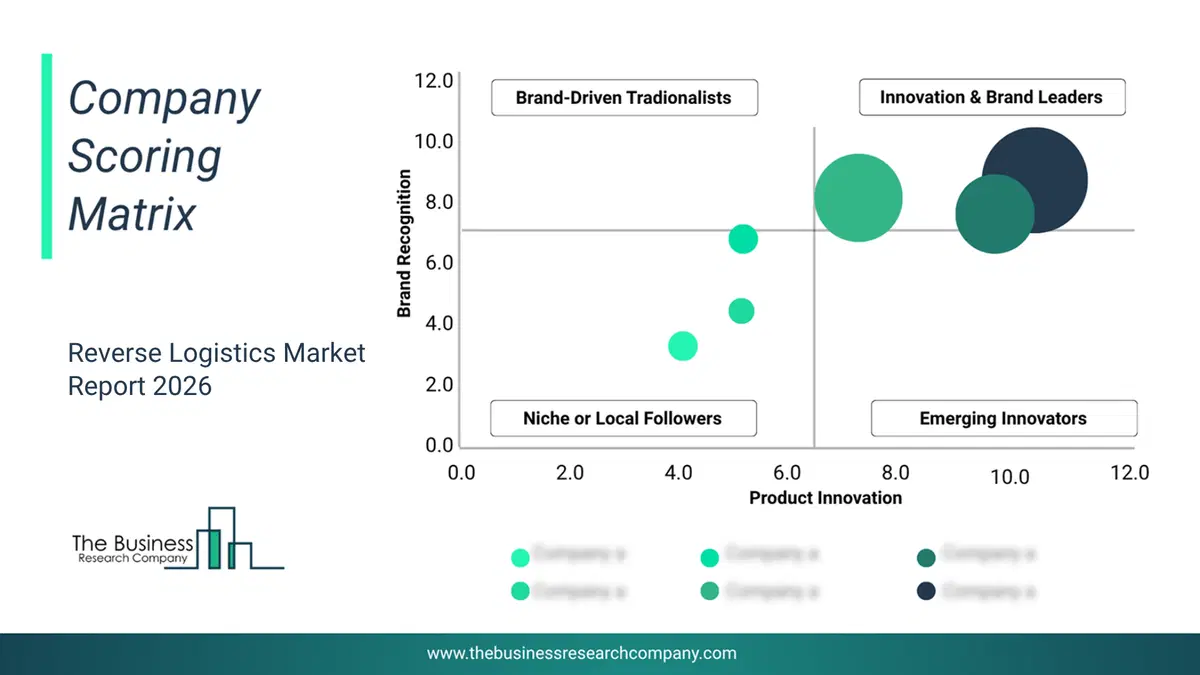
This chart maps companies by product innovation and brand strength, with bubble size indicating relative revenue, helping identify market leaders, challengers, and niche players. This is an illustrative chart; the full report provides a complete and accurate competitive analysis.
Global Reverse Logistics Market Trends and Insights
Major companies operating in the reverse logistics market are focusing on developing innovative logistics infrastructure such as pickup point–based reverse logistics platforms to enhance efficiency, reliability, and control in time-sensitive healthcare logistics. Pickup point–based reverse logistics platforms are prearranged physical locations integrated into logistics networks where shipments, returns, or samples are consolidated, enabling streamlined collection, reduced handling complexity, and improved shipment coordination. For instance, in October 2023, UPS Healthcare, a US-based reverse logistics company, launched a reverse logistics service in Europe. The service, known as UPS Pickup Point locations, is a new reverse logistics solution for health laboratory customers. These pickup points aim to streamline the collection and shipment of samples to a central lab, providing a more efficient solution for healthcare companies by decreasing the number of collection sites and improving reliability and control. This initiative is a response to the challenges that healthcare-related logistics present, particularly in managing the reverse logistics of healthcare-related shipments. Additionally, these benefits make UPS Pickup Point locations a convenient and efficient option for managing shipping and receiving needs.What Are Latest Mergers And Acquisitions In The Reverse Logistics Market?
In November 2023, BlueYonder, a US-based supply chain solutions provider, acquired Doddle Parcel Services Ltd. for an undisclosed amount. The acquisition is expected to enhance its capabilities in the first and final mile with Doddle’s innovative products. The acquisition allows Blue Yonder to offer end-to-end supply chain management and logistics, including reverse logistics and returns management, for retailers and 3PL. Doddle Parcel Services Ltd. is a Switzerland-based provider of reverse logistics for carriers.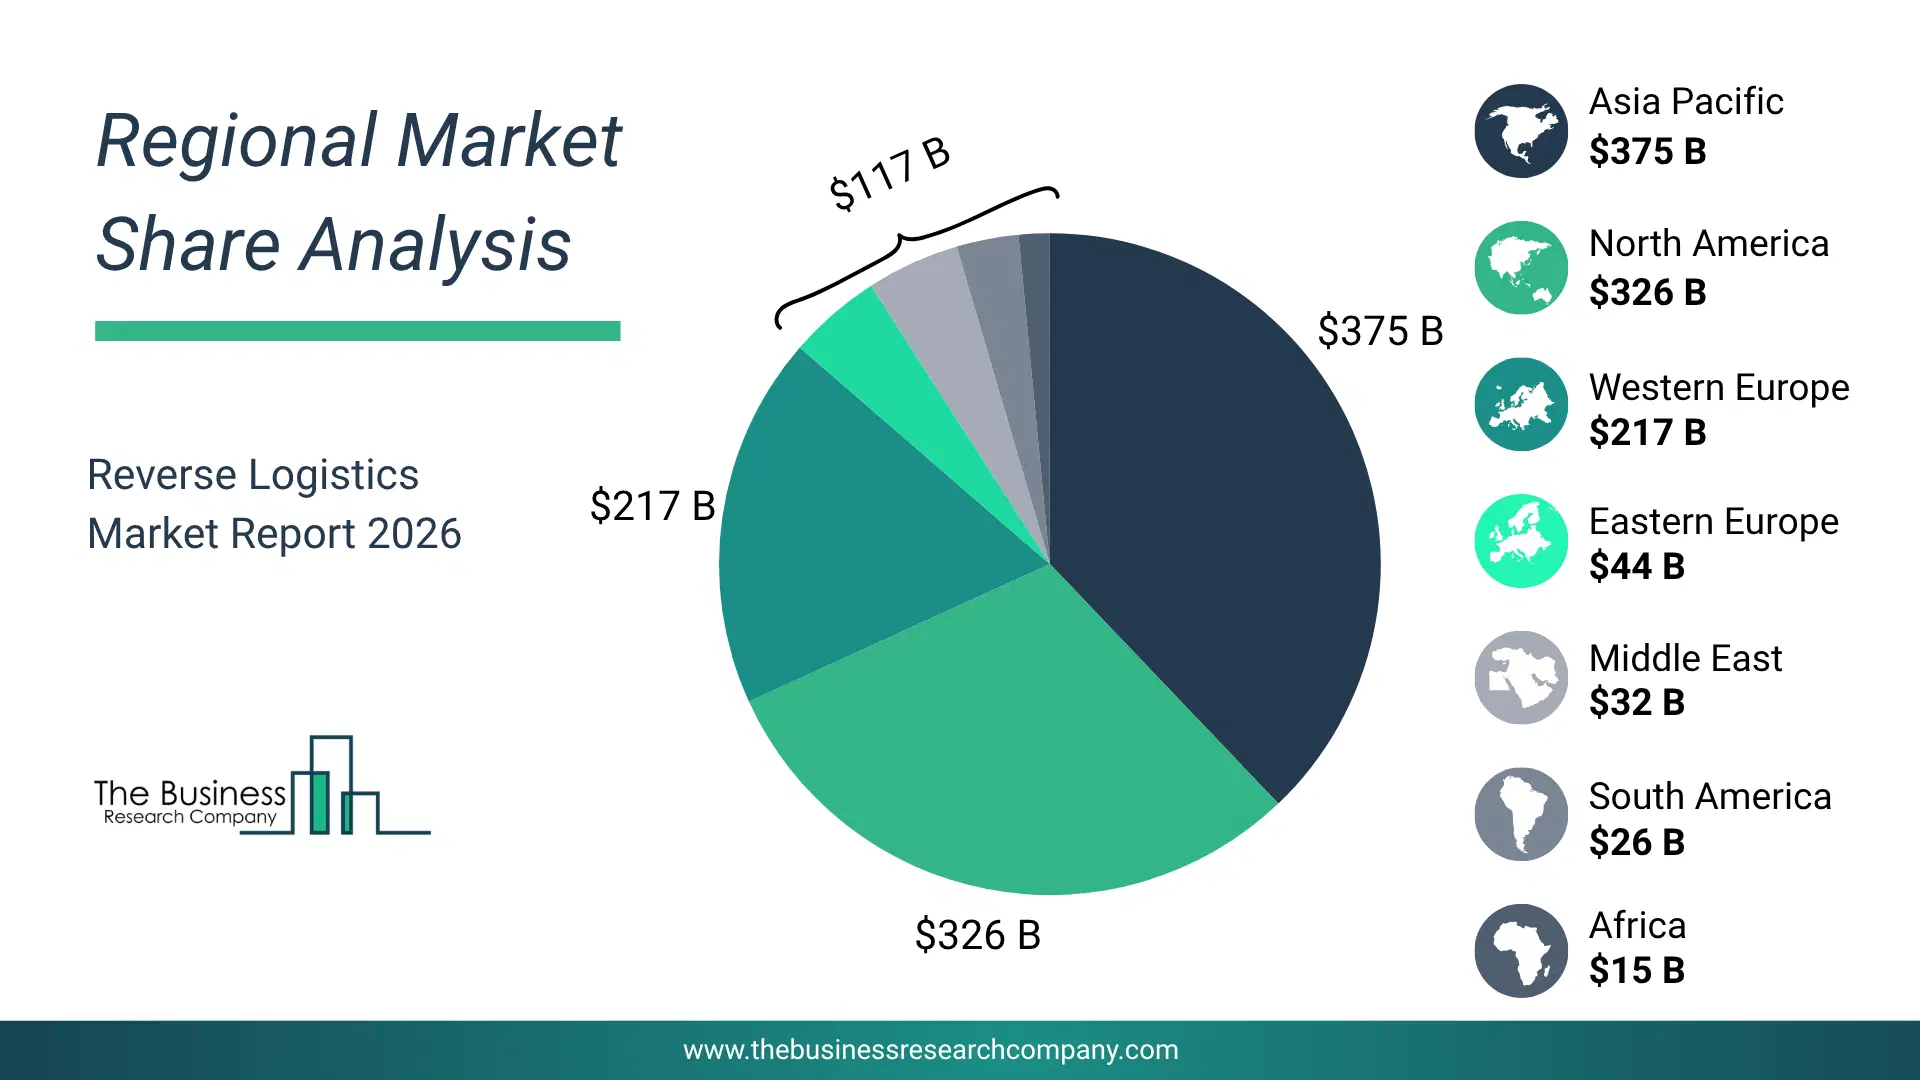
Regional Outlook
Asia-Pacific was the largest region in the reverse logistics market in 2025. The regions covered in this market report are Asia-Pacific, South East Asia, Western Europe, Eastern Europe, North America, South America, Middle East, Africa. The countries covered in this market report are Australia; Brazil; China; France; Germany; India; Indonesia; Japan; Taiwan; Russia; South Korea; UK; USA; Canada; Italy; Spain.What Defines the Reverse Logistics Market?
The reverse logistics market consists of revenues earned by entities by providing services such as product returns, remanufacturing and refurbishing, recycling, and waste management. The market value includes the value of related goods sold by the service provider or included within the service offering. The reverse logistics market also includes sales of pallets, dunnage, and shipping containers. Values in this market are ‘factory gate’ values, that is the value of goods sold by the manufacturers or creators of the goods, whether to other entities (including downstream manufacturers, wholesalers, distributors, and retailers) or directly to end customers. The value of goods in this market includes related services sold by the creators of the goods.How is Market Value Defined and Measured?
The market value is defined as the revenues that enterprises gain from the sale of goods and/or services within the specified market and geography through sales, grants, or donations in terms of the currency (in USD unless otherwise specified). The revenues for a specified geography are consumption values that are revenues generated by organizations in the specified geography within the market, irrespective of where they are produced. It does not include revenues from resales along the supply chain, either further along the supply chain or as part of other products.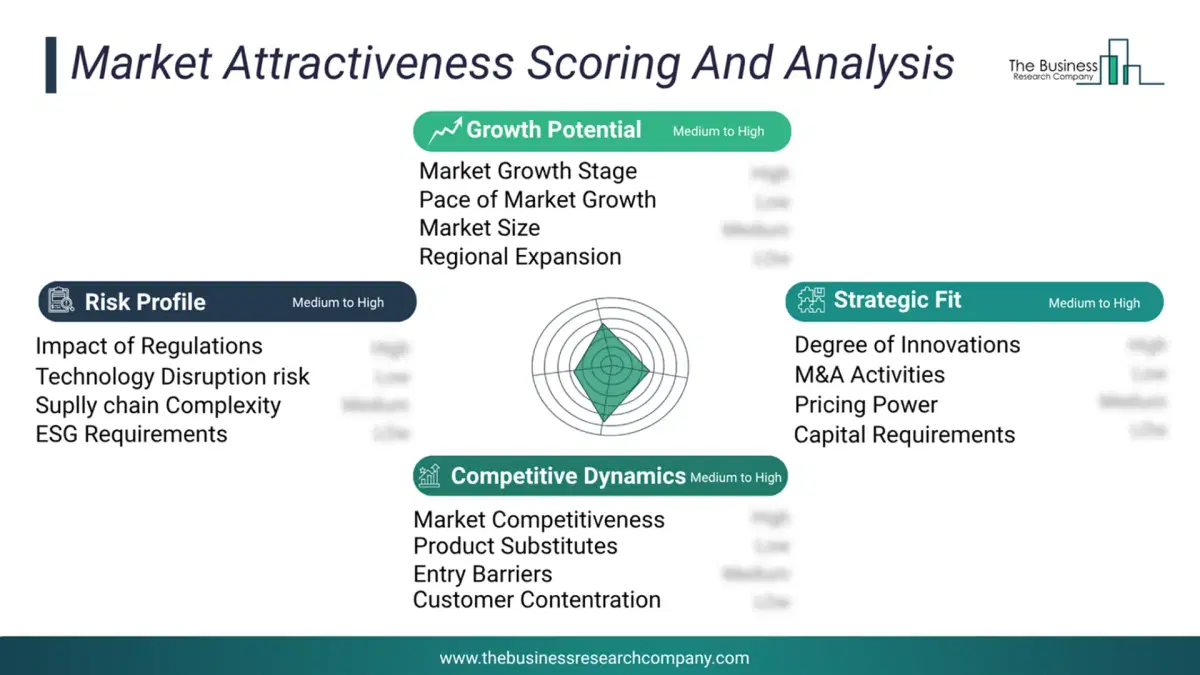
This chart presents market attractiveness based on a quantitative evaluation of growth, competition, strategic alignment, and risk, offering a clear view of opportunity areas for decision-making. This chart is for illustrative purposes; the full report contains the complete analysis.
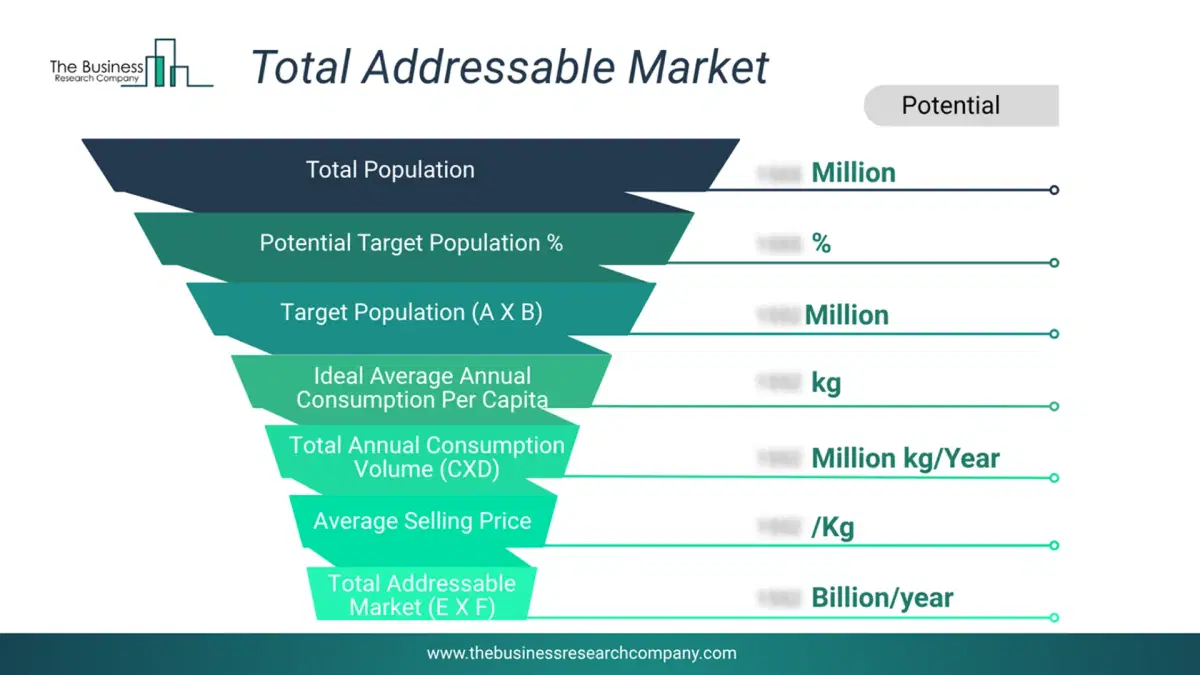
This chart highlights the Total Addressable Market (TAM) by estimating the maximum revenue opportunity using an assumption-driven approach, supporting strategic planning and opportunity sizing across markets. The chart is illustrative; the full report provides a more comprehensive analysis.
What Key Data and Analysis Are Included in the Reverse Logistics Market Report 2026?
The reverse logistics market research report is one of a series of new reports from The Business Research Company that provides market statistics, including Market Report 2026?global market size, regional shares, competitors with the market share, detailed market segments, market trends and opportunities, and any further data you may need to thrive in the reverse logistics Market Report 2026? The market research report delivers a complete perspective of everything you need, with an in-depth analysis of the current and future state of the Market Report 2026?Reverse Logistics Market Report Forecast Analysis
| Report Attribute | Details |
|---|---|
| Market Size Value In 2026 | $822.12 billion |
| Revenue Forecast In 2030 | $1041.46 billion |
| Growth Rate | CAGR of 6.3% from 2026 to 2030 |
| Base Year For Estimation | 2025 |
| Actual Estimates/Historical Data | 2020-2025 |
| Forecast Period | 2026 - 2030 |
| Market Representation | Revenue in USD Billion and CAGR from 2026 to 2030 |
| Segments Covered | Return Type, Service, End User |
| Regional Scope | Asia-Pacific, Western Europe, Eastern Europe, North America, South America, Middle East, Africa |
| Country Scope | The countries covered in the report are Australia, Brazil, China, France, Germany, India, Indonesia, Japan, Taiwan, Russia, South Korea, UK, USA, Canada, Italy, Spain. |
| Key Companies Profiled | Deutsche Post DHL Group, United Parcel Service Inc., FedEx Corporation, Schenker AG, Kuehne + Nagel International AG, DSV Panalpina A/S, C.H. Robinson Worldwide, Dachser SE, Nippon Express Co. Ltd., Expeditors International of Washington Inc., J.B. Hunt Transport Services Inc., Ryder System Inc., Kerry Logistics Network Limited, XPO Logistics Inc, Landstar System Inc., Kintetsu World Express Inc., ArcBest Corporation, Zebra Technologies Corp, Hellmann Worldwide Logistics, Echo Global Logistics Inc., Yusen Logistics Co. Ltd., Agility Logistics, Safexpress Pvt. Ltd, CEVA Logistics AG, RLG Systems AG |
| Customization Scope | Request for Customization |
| Pricing And Purchase Options | Explore Purchase Options |