

Sushi Restaurants Market Report 2026
Global Outlook – By Type (Single Sushi Restaurant, Conveyor Belt Sushi Restaurant), By Restaurant Size (Small And Medium Sushi Bars, Large Scale Restaurants, Boutique Sushi Cafes, Fine Dining), By Consumer Preferences (Dine-In, Takeaway, Delivery), By Applications (Local Market, International Chain Market), By End-User (Residential, Commercial) – Market Size, Trends, Strategies, and Forecast to 2030
Sushi Restaurants Market Overview
• Sushi Restaurants market size has reached to $17.03 billion in 2025 • Expected to grow to $24.1 billion in 2030 at a compound annual growth rate (CAGR) of 7.2% • Growth Driver: Rising Global Appeal Of Japanese Cuisine Fueling The Growth Of The Sushi Restaurant Market Due To Cultural Influence And Culinary Interest • Market Trend: Sushi Restaurant Chains Embrace Brand Extension Strategies To Expand And Localize Offerings • North America was the largest region in 2025 and Asia-Pacific is the fastest growing region.Market Gains By 2030 – Top Opportunities By Segment
Market Gain identifies the most promising market opportunities by highlighting the segments or products expected to generate the highest incremental revenue growth over the next five years.
What Is Covered Under Sushi Restaurants Market?
Sushi restaurants are dining establishments that specialize in preparing and serving sushi, a traditional Japanese dish typically made with vinegared rice, seafood, vegetables, and sometimes tropical fruits. These restaurants focus on freshness, presentation, and authentic Japanese culinary techniques, catering to a wide range of customers from casual diners to high-end food enthusiasts. The main types of sushi restaurants are single sushi restaurants and conveyor belt sushi restaurants. A single sushi restaurant is an independently operated sushi establishment that typically offers a traditional dining experience, where customers order sushi directly from a chef or a printed menu. This category encompasses a range of restaurant types, including small and medium sushi bars, large-scale restaurants, boutique sushi cafes, and fine dining, designed for various consumer preferences such as dine-in, takeaway, and delivery. It is used for various applications, including local markets, international chain markets, and catering to diverse end users, including residential and commercial.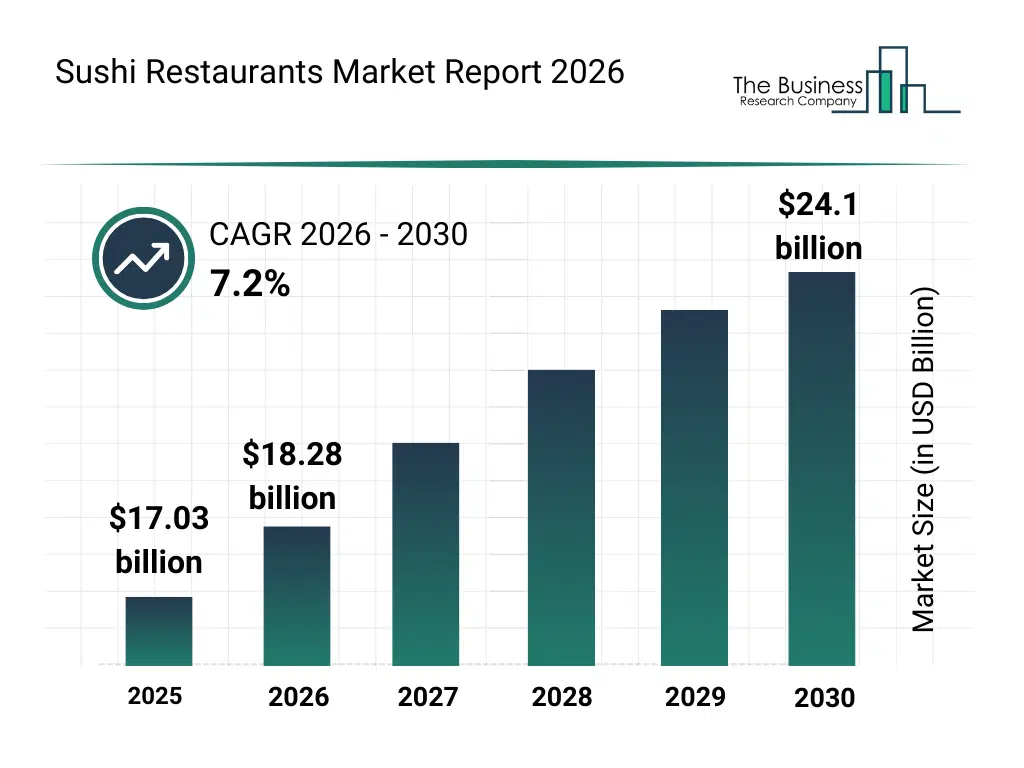
What Is The Sushi Restaurants Market Size and Share 2026?
The sushi restaurants market size has grown strongly in recent years. It will grow from $17.03 billion in 2025 to $18.28 billion in 2026 at a compound annual growth rate (CAGR) of 7.3%. The growth in the historic period can be attributed to global popularity of japanese cuisine, urban dining culture growth, premium dining demand, expansion of food delivery platforms, international restaurant chains.What Is The Sushi Restaurants Market Growth Forecast?
The sushi restaurants market size is expected to see strong growth in the next few years. It will grow to $24.1 billion in 2030 at a compound annual growth rate (CAGR) of 7.2%. The growth in the forecast period can be attributed to robotic sushi preparation adoption, traceable seafood sourcing, experiential dining formats, health-conscious menu innovation, global expansion of sushi brands. Major trends in the forecast period include premium and omakase dining, automation in food preparation, sustainable seafood sourcing, digital ordering and delivery, global sushi fusion menus.
Global Sushi Restaurants Market Segmentation
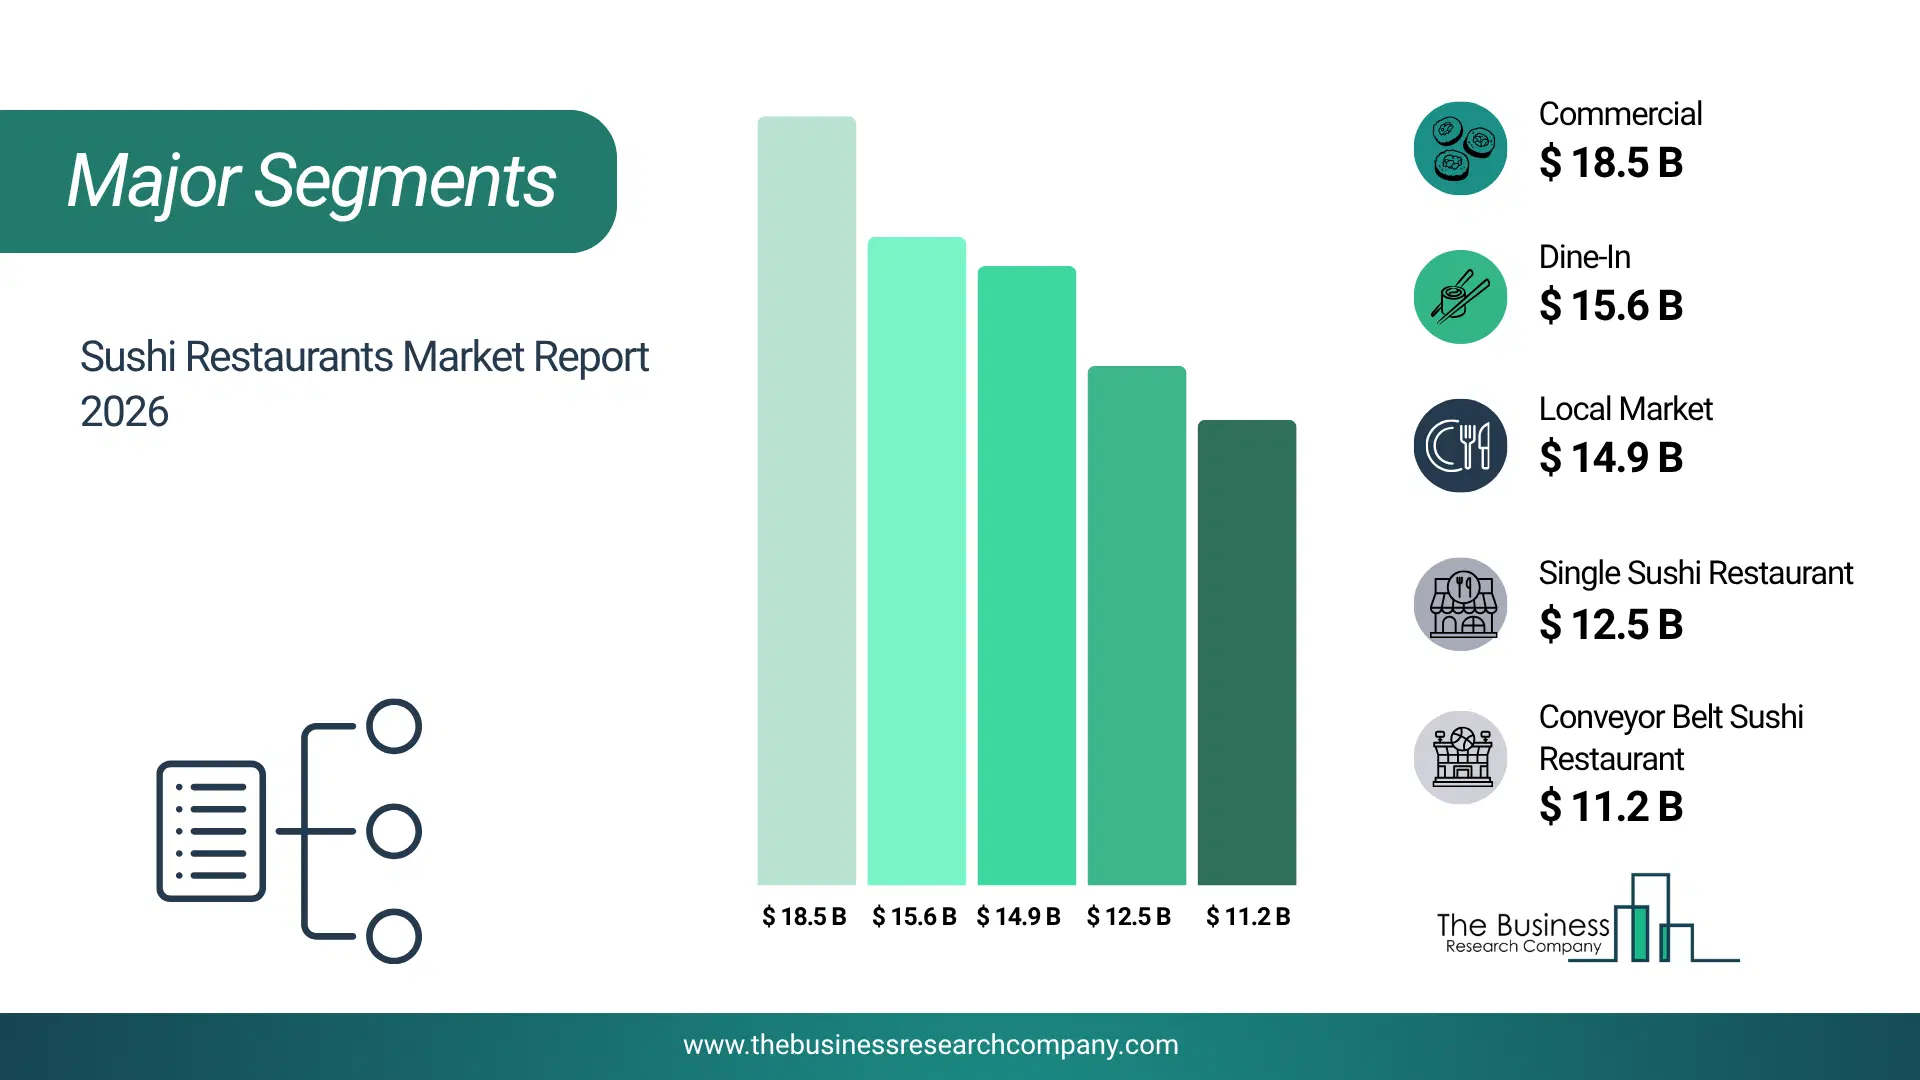
1) By Type: Single Sushi Restaurant, Conveyor Belt Sushi Restaurant 2) By Restaurant Size: Small And Medium Sushi Bars, Large Scale Restaurants, Boutique Sushi Cafes, Fine Dining 3) By Consumer Preferences: Dine-In, Takeaway, Delivery 4) By Applications: Local Market, International Chain Market 5) By End-User: Residential, Commercial Subsegments: 1) By Single Sushi Restaurant: Traditional Sushi Bars, Omakase Sushi Restaurants, Takeaway Or Grab-And-Go Sushi Outlets, High-End Fine Dining Sushi Establishments, Casual Dining Sushi Restaurants 2) By Conveyor Belt Sushi Restaurant: Automated Sushi Conveyor Restaurants, Touchscreen Ordering Conveyor Sushi Restaurants, All-You-Can-Eat Conveyor Sushi Chains, Compact Urban Conveyor Outlets, Family-Friendly Conveyor Sushi Restaurants The top segments in the sushi restaurants market will be: • Commercial will reach $18514.91 Million by 2030. • Dine-In will reach $15616.99 Million by 2030. • Local Market will reach $14980.28 Million by 2030. • Single Sushi Restaurant will reach $12549.88 Million by 2030. • Conveyor Belt Sushi Restaurant will reach $11254.36 Million by 2030.What Is The Driver Of The Sushi Restaurants Market?
The rising global appeal of Japanese cuisine is expected to propel the growth of the sushi restaurant market going forward. Japanese cuisine refers to the traditional food and culinary practices of Japan, characterized by an emphasis on fresh, seasonal ingredients, balanced flavors, and artistic presentation. The increasing interest in Japanese cuisine is driven by globalization, which exposes people to diverse cultures, promotes the exchange of culinary traditions, and makes ingredients and dining experiences more accessible worldwide. Sushi restaurants support cultural exchange by preserving traditional cooking techniques and introducing regional variations to international audiences. For instance, in May 2024, according to the Japan National Tourism Organization (JNTO), a Japan-based government tourism promotion agency, Japan welcomed approximately 36.87 million international visitors, up from 25.07 million in 2023, marking a 46.9% year-on-year increase in inbound tourism. Therefore, the rising global appeal of Japanese cuisine is driving the growth of the sushi restaurant industry.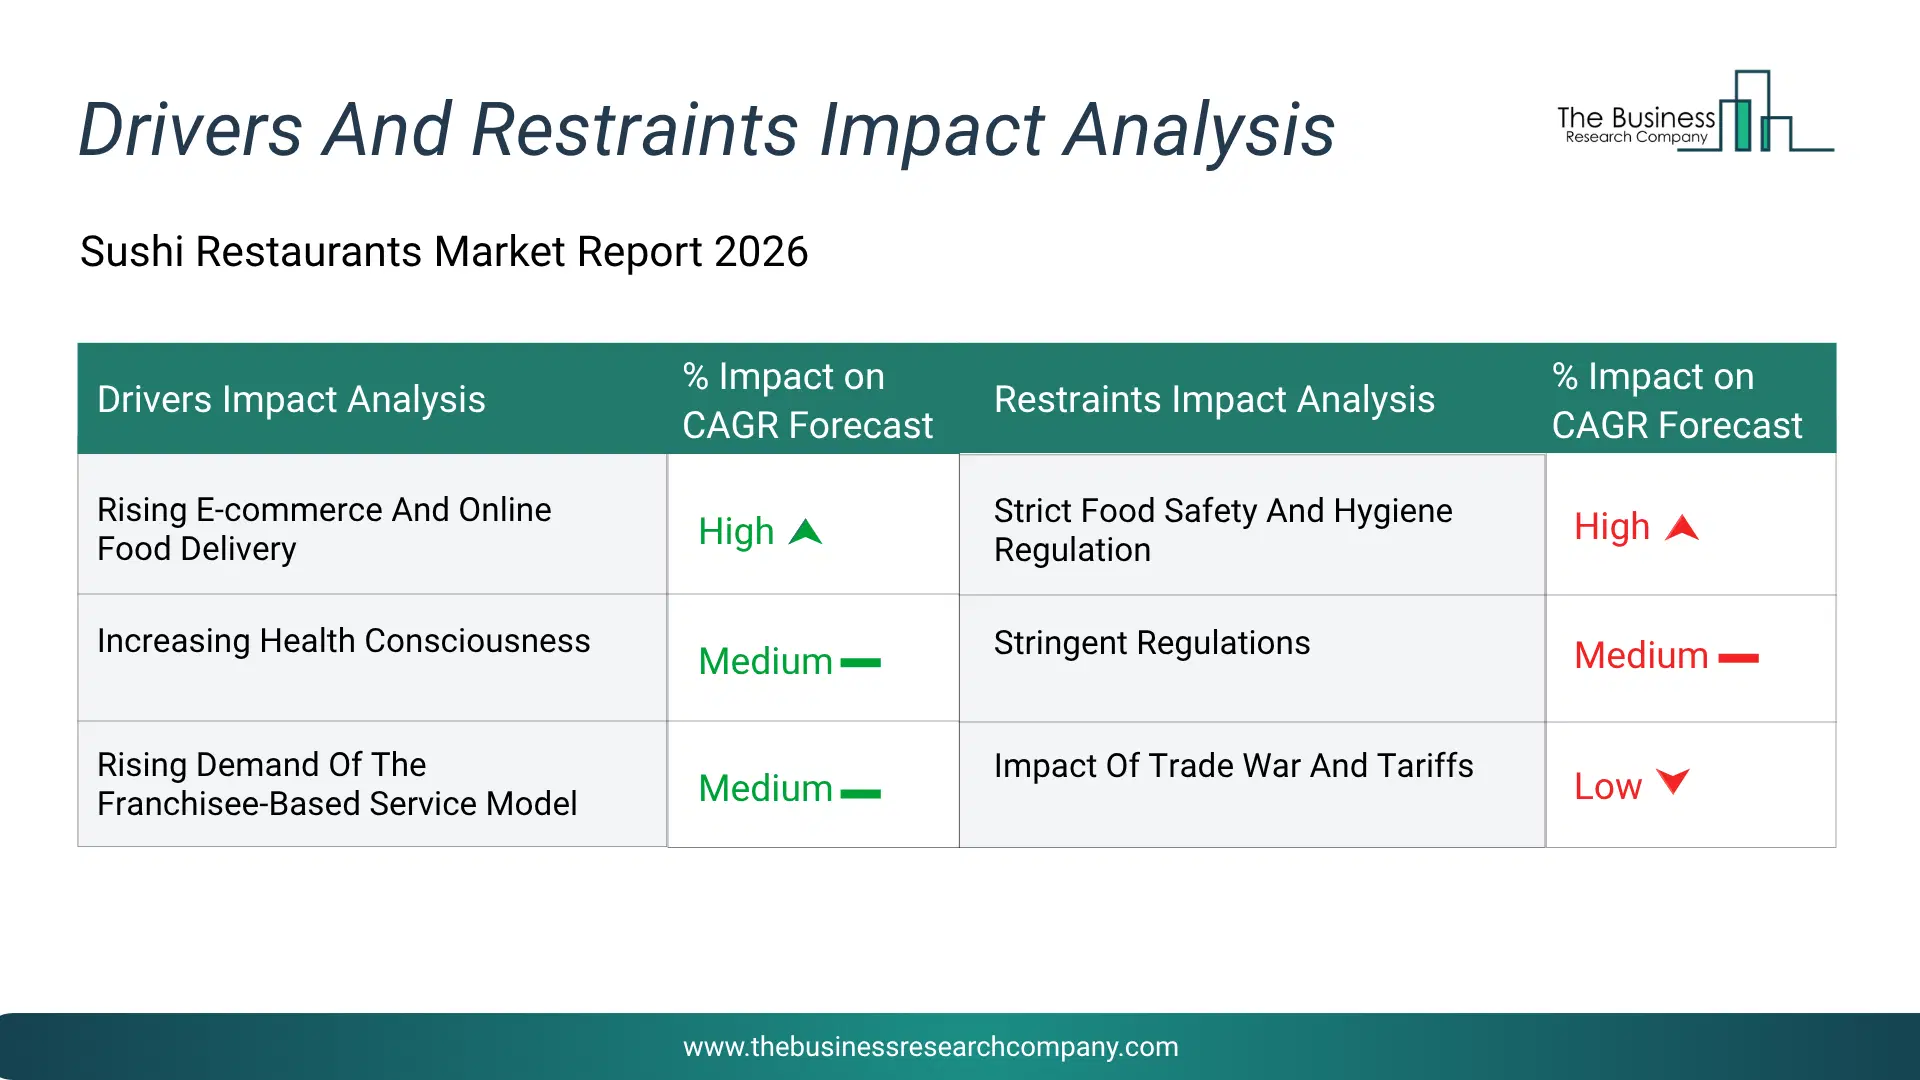
Infographic Chart Showing Key Market Drivers Analysis And Restraints For Sushi Restaurants Market
The chart presents an impact analysis of key drivers and restraints, quantifying their relative influence on the market's growth rate and helping assess the balance between growth enablers and limiting factors. This chart offers a high-level perspective; the full report contains more detailed insights.
How Will The Drivers Impact Growth In The Global Sushi Restaurants Market?
• Rising E-commerce And Online Food Delivery (High) – During the forecast period, the ongoing expansion of e-commerce and online food delivery is projected to significantly drive the growth of the sushi restaurant market. Widespread smartphone adoption, improved internet access, and user-friendly digital platforms are making it easier for consumers to order sushi at their convenience, anytime and from anywhere. As digital ordering becomes more prevalent, sushi restaurants are adapting by refining their menus for takeout and delivery, using innovative packaging to maintain freshness and visual appeal. This shift to online platforms is also enabling sushi establishments to tap into new customer segments beyond traditional dine-in patrons. The rising e-commerce and online food delivery growth contribution during the forecast period in 2025 is 2.0%. • Increasing Health Consciousness (Medium) – During the forecast period, increasing health consciousness among consumers is expected to play a key role in driving the growth of the sushi restaurant market. As more people focus on wellness, clean eating, and nutrient-rich diets, sushi stands out for its use of fresh seafood, balanced components, and minimal processing—making it a natural fit for modern dietary preferences. This shift toward healthier eating habits presents an opportunity for sushi brands to stand out by emphasizing transparency, high-quality ingredients, and nutritional benefits. With consumers actively seeking convenient, flavorful, yet wholesome food choices, sushi restaurants are well-positioned to meet this rising demand. The increasing health consciousness growth contribution during the forecast period in 2025 is 1.5%. • Rising Demand Of The Franchisee-Based Service Model (Medium) – During the forecast period, the growing preference for franchise-based service models is anticipated to boost the expansion of the sushi restaurant market. Franchising enables well-known sushi brands to scale quickly while minimizing capital investment by partnering with local entrepreneurs. This approach ensures consistency in food quality, service, and brand experience across various locations, fostering customer loyalty and trust. Additionally, franchise operations benefit from centralized training, streamlined supply chains, and coordinated marketing efforts, making them more adaptable to operational and economic challenges than standalone outlets. As urban consumers increasingly gravitate toward familiar and dependable dining options, franchise sushi restaurants are well-positioned to meet rising demand. The growing preference for franchise-based service models growth contribution during the forecast period in 2025 is 1.3%. • Influence Of Marketing And Digital Presence (Low) – During the forecast period, the growing impact of marketing and digital presence is expected to significantly drive the sushi restaurant market. As consumers increasingly rely on online platforms for dining inspiration, information, and ordering, sushi establishments that leverage digital tools—such as mobile apps, social media engagement, and review management—can enhance both visibility and customer trust. Well-executed marketing strategies and immersive digital branding allow sushi restaurants to connect with wider audiences and foster loyalty among health-conscious and experience-driven diners. The growing impact of marketing and digital presence growth contribution during the forecast period in 2025 is 0.5%.How Will The Restraints Impact Growth In The Global Sushi Restaurants Market?
• Strict Food Safety And Hygiene Regulation (High) – During the forecast period, stringent food safety and hygiene regulations are expected to act as a restraint on the growth of the sushi restaurant market. Because sushi typically involves raw or lightly processed fish, it carries inherent health risks if not prepared and handled under strict sanitary conditions. Regulatory authorities in various regions are tightening compliance standards, including regular health inspections, traceability of ingredients, temperature-controlled storage and transport, and mandatory hygiene certifications for staff. Meeting these requirements can significantly raise operational costs, particularly for small businesses or new entrants, potentially deterring market entry and hindering expansion efforts. Growth affected by the stringent food safety and hygiene regulations during the forecast period in 2025 is -2.0%. • Stringent Regulations (Medium) – During the forecast period, strict food safety and hygiene regulations are expected to pose challenges to the growth of the sushi restaurant market. Given that sushi involves raw or minimally processed ingredients, it is especially vulnerable to contamination, making it subject to stringent health standards and frequent inspections. Compliance with these evolving regulations often demands substantial investment in infrastructure, staff training, traceability, and sanitation practices. Smaller or independent sushi restaurants may find it difficult to consistently meet these requirements, potentially facing fines, temporary closures, or limited access to certain markets. While these regulations are essential for ensuring consumer safety, they also increase operational complexity and costs, particularly for businesses looking to expand into new or highly regulated regions. Growth affected by the strict food safety and hygiene regulations during the forecast period in 2025 is -1.0%. • Impact Of Trade War And Tariffs (Medium) – During the forecast period, trade wars and tariff-related challenges are expected to constrain the growth of the sushi restaurant market. Key sushi ingredients such as high-quality seafood, rice, nori, and specialty condiments—are frequently imported from global suppliers. The imposition of tariffs due to geopolitical tensions or protectionist measures can significantly raise import costs for these essential items. As a result, restaurant operators may face reduced profit margins or be forced to increase menu prices, potentially alienating price-sensitive customers. In addition, retaliatory tariffs and unstable trade dynamics can disrupt supply chains and reduce sourcing flexibility, further impacting operational efficiency and market expansion. Growth affected by the trade wars and tariff-related challenges during the forecast period in 2025 is -0.3%.Key Players In The Global Sushi Restaurants Market
Major companies operating in the sushi restaurants market are Genki Sushi Co. Ltd., RA Sushi Bar Restaurant LLC, Kura Sushi USA Inc., Hamazushi Co. Ltd., Nobu Hospitality LLC, Sushi-Tei Pte Ltd., Sushi Zushi LLC, Sushi Samba, Itacho Sushi, Morimoto Management LLC, Sushi Itto S.A. de C.V., Sakae Sushi, Blue Ribbon Restaurants, Sushi Nakazawa LLC, Akindo Sushiro Co. Ltd., Fuji Sushi Inc., Innovative Dining Group LLC, Pisces Sushi Bistro Inc., Sukiyabashi Jiro Co. Ltd., Wasabi Sushi Bento Limited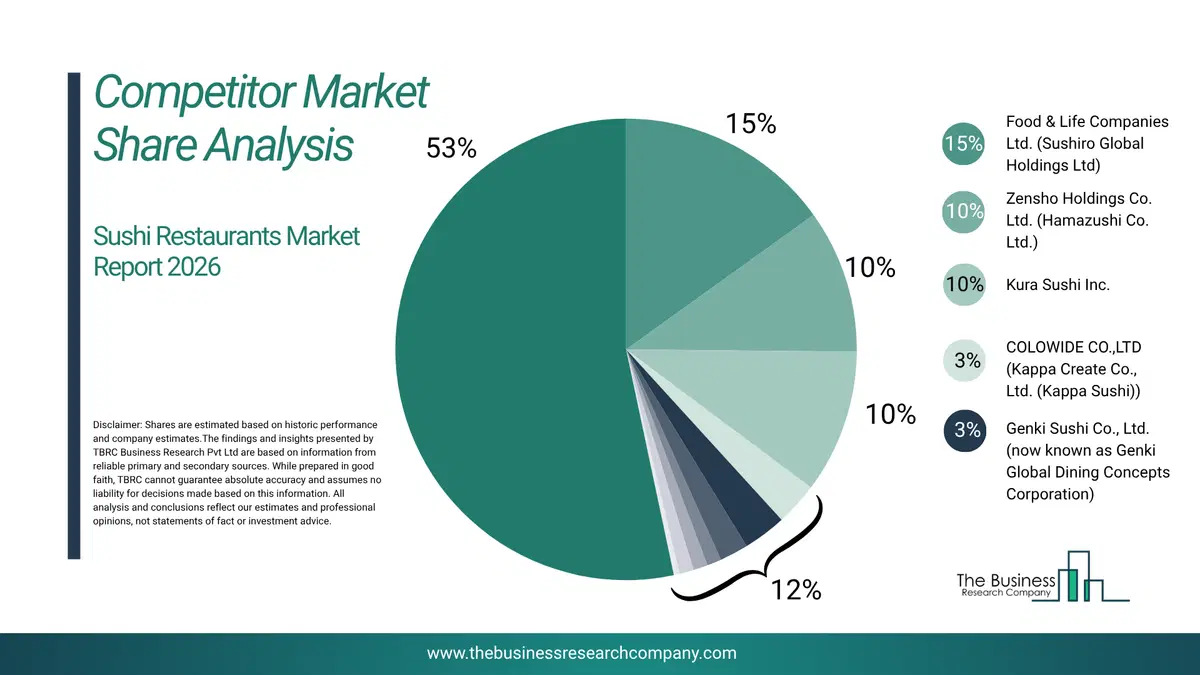
This chart is for illustrative purposes; the full report includes a detailed competitor analysis and comprehensive overview of the top 10 companies in the market.
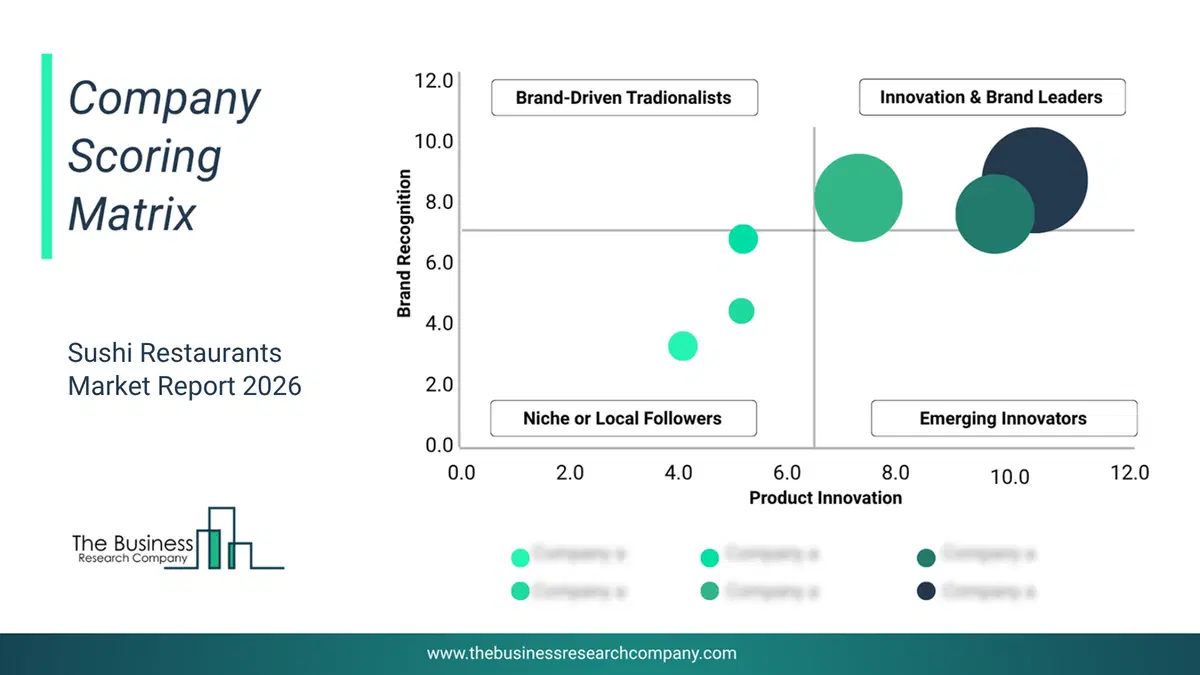
This chart maps companies by product innovation and brand strength, with bubble size indicating relative revenue, helping identify market leaders, challengers, and niche players. This is an illustrative chart; the full report provides a complete and accurate competitive analysis.
Global Sushi Restaurants Market Trends and Insights
Major companies operating in the sushi restaurant market are prioritizing innovative strategies, such as brand extension initiatives, to expand their market presence, attract a broader customer base, and enhance brand loyalty. Brand extension initiatives refer to a marketing strategy where a company leverages the reputation and recognition of an existing brand to launch new products, services, or restaurant formats in different categories or segments. For instance, in May 2024, Food & Life Companies Ltd., a Japan-based company specializing in food service and restaurant management, opened its first U.S. sushi izakaya restaurant, Sakabayashi Sushi Tavern Back Bay, in Boston. The tavern offers an authentic sushi izakaya experience with a menu featuring about 30 types of sushi, 50 a la carte dishes including sashimi, tempura, and ramen, plus around 40 drink options including sake and sake-based cocktails tailored for U.S. customers. The 82-seat venue blends traditional Japanese izakaya elements with Boston-inspired interior motifs, aiming to provide locals with a genuine yet approachable Japanese dining experience.What Are Latest Mergers And Acquisitions In The Sushi Restaurants Market?
In February 2024, McWin Capital Partners Limited, a UK-based investment management firm specializing in fund management activities, acquired Sticks 'N' Sushi UK Limited for an undisclosed amount. With this acquisition, McWin Food Ecosystem Fund aims to accelerate the international expansion of Sticks’n’Sushi by leveraging its strategic expertise, operational resources, and industry network to strengthen the brand’s presence in existing markets and enter new geographies while preserving its unique fusion of Japanese and Nordic dining experiences. Sticks 'N' Sushi UK Limited is a Denmark-based restaurant and takeaway group specializing in sushi and yakitori.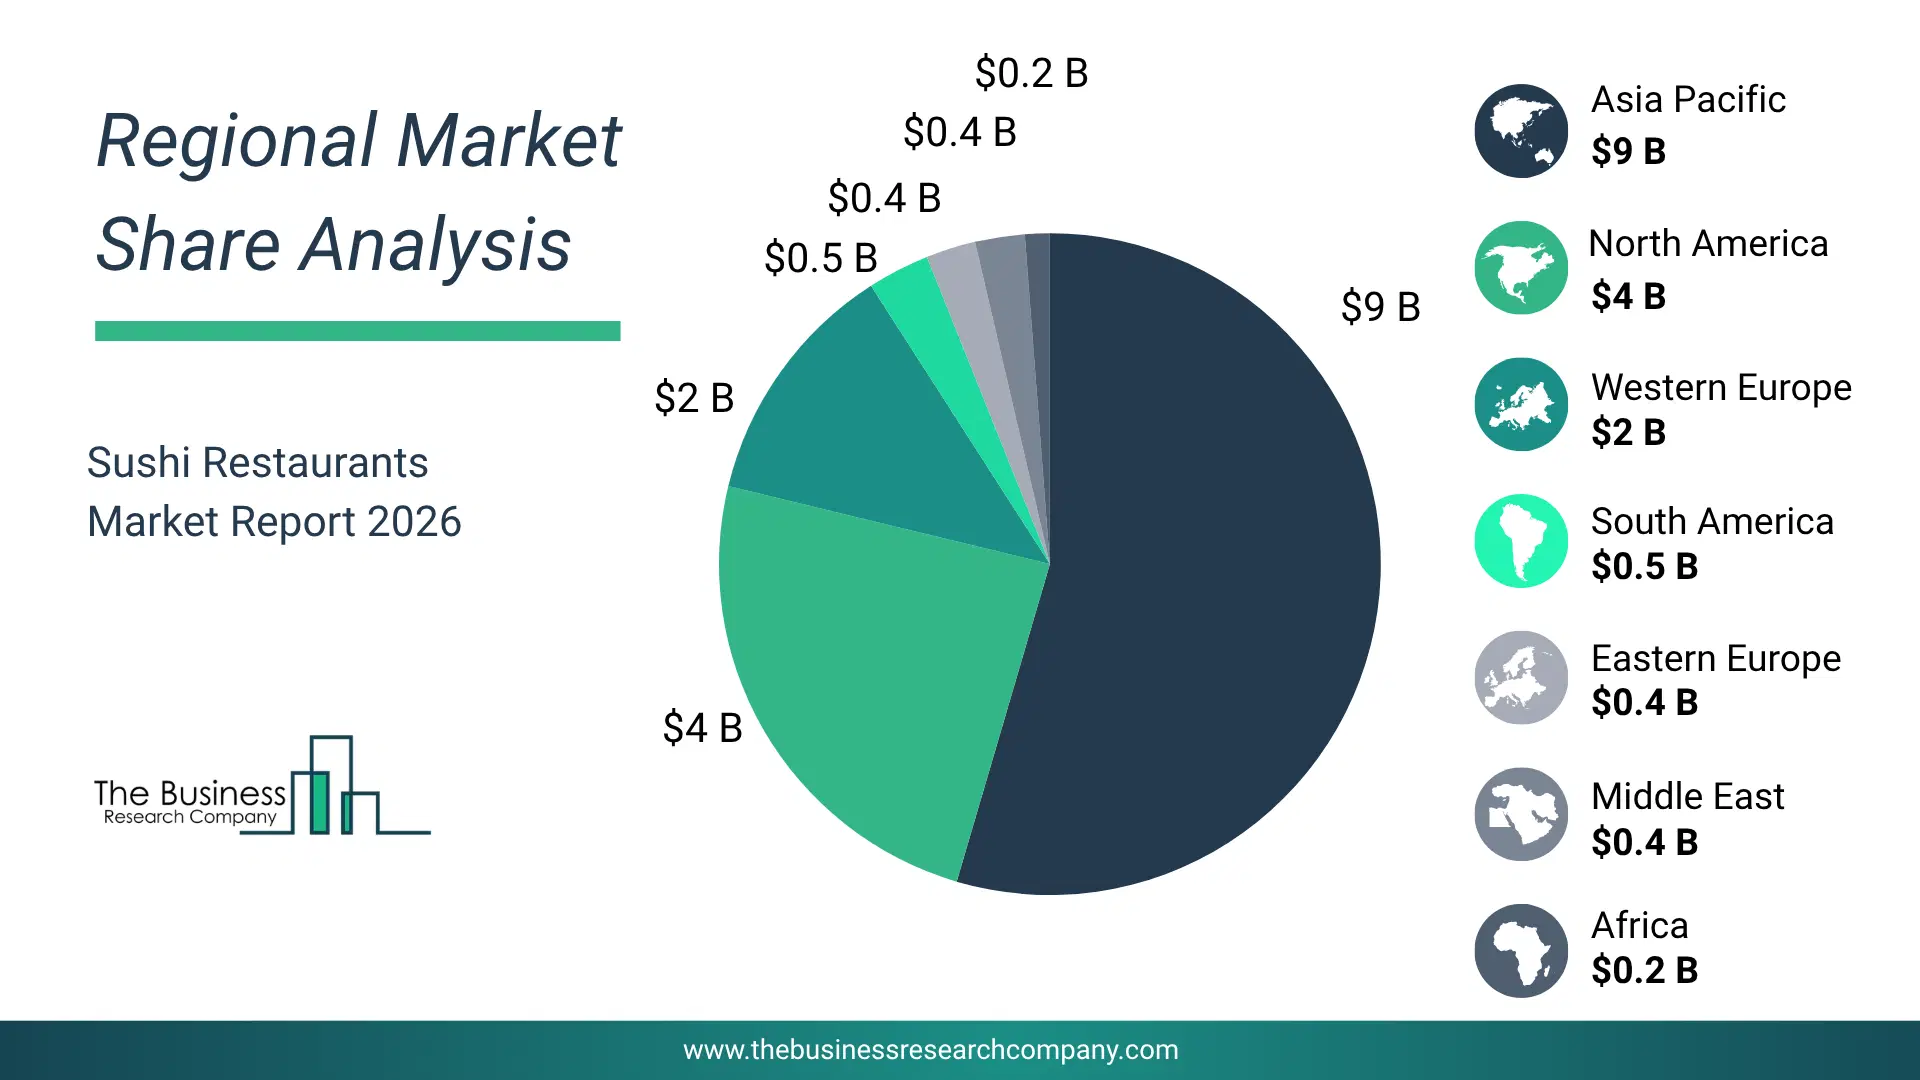
Regional Outlook
North America was the largest region in the sushi restaurants market in 2025. Asia-Pacific is expected to be the fastest-growing region in the forecast period. The regions covered in this market report are Asia-Pacific, South East Asia, Western Europe, Eastern Europe, North America, South America, Middle East, Africa. The countries covered in this market report are Australia, Brazil, China, France, Germany, India, Indonesia, Japan, Taiwan, Russia, South Korea, UK, USA, Canada, Italy, SpainWhat Defines the Sushi Restaurants Market?
The sushi restaurants market includes revenues earned by entities by providing services such as dine-in service, sushi bar experience, custom sushi orders, special menu services, online ordering, and cooking classes or sushi workshops. The market value includes the value of related goods sold by the service provider or included within the service offering. Only goods and services traded between entities or sold to end consumers are included.How is Market Value Defined and Measured?
The market value is defined as the revenues that enterprises gain from the sale of goods and/or services within the specified market and geography through sales, grants, or donations in terms of the currency (in USD unless otherwise specified). The revenues for a specified geography are consumption values that are revenues generated by organizations in the specified geography within the market, irrespective of where they are produced. It does not include revenues from resales along the supply chain, either further along the supply chain or as part of other products.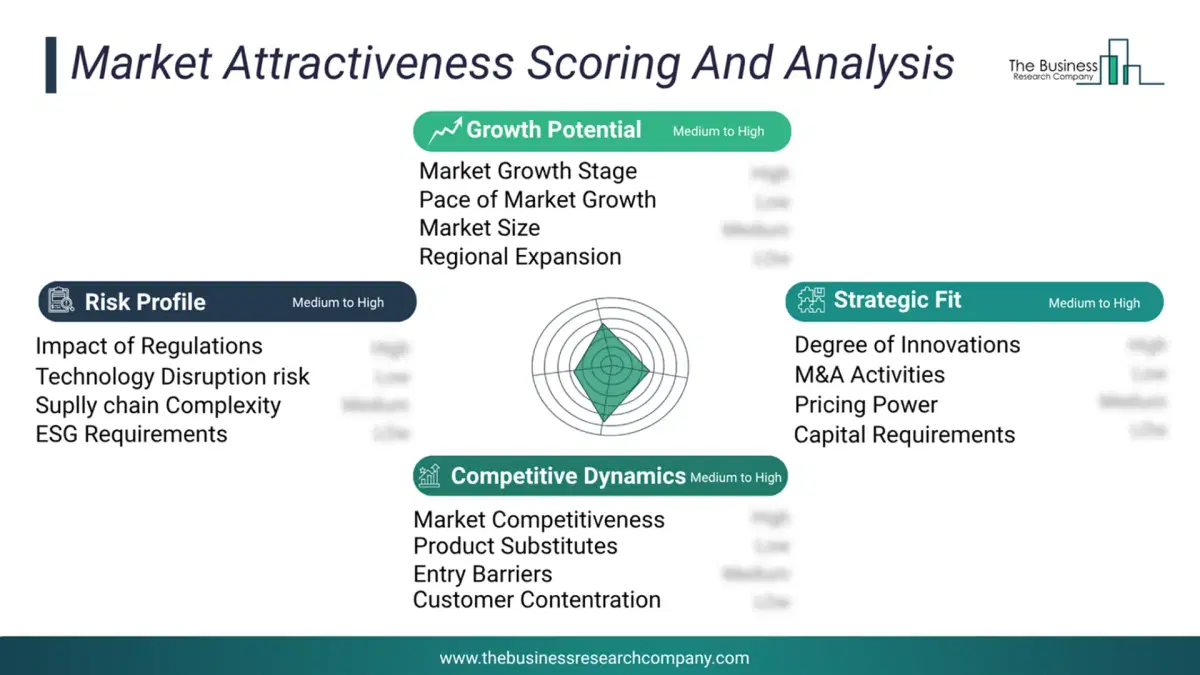
This chart presents market attractiveness based on a quantitative evaluation of growth, competition, strategic alignment, and risk, offering a clear view of opportunity areas for decision-making. This chart is for illustrative purposes; the full report contains the complete analysis.
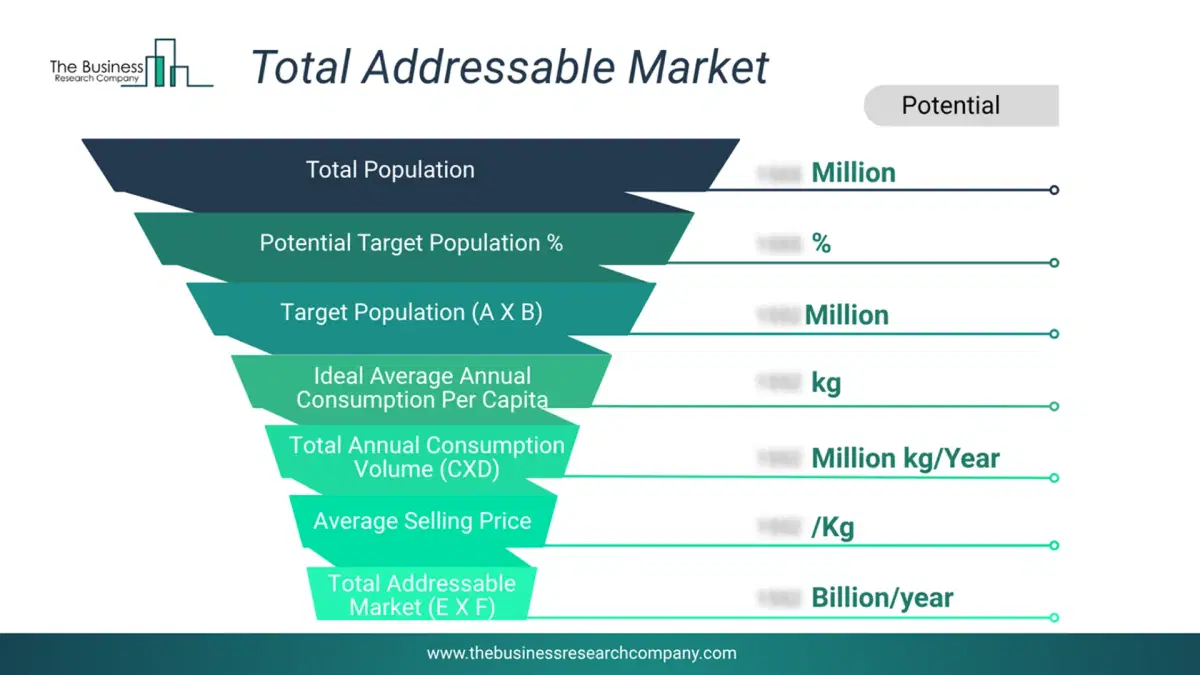
This chart highlights the Total Addressable Market (TAM) by estimating the maximum revenue opportunity using an assumption-driven approach, supporting strategic planning and opportunity sizing across markets. The chart is illustrative; the full report provides a more comprehensive analysis.
What Key Data and Analysis Are Included in the Sushi Restaurants Market Report 2026?
The sushi restaurants market research report is one of a series of new reports from The Business Research Company that provides market statistics, including industry global market size, regional shares, competitors with the market share, detailed market segments, market trends and opportunities, and any further data you may need to thrive in the sushi restaurants industry. The market research report delivers a complete perspective of everything you need, with an in-depth analysis of the current and future state of the industry.Sushi Restaurants Market Report Forecast Analysis
| Report Attribute | Details |
|---|---|
| Market Size Value In 2026 | $18.28 billion |
| Revenue Forecast In 2030 | $24.1 billion |
| Growth Rate | CAGR of 7.2% from 2026 to 2030 |
| Base Year For Estimation | 2025 |
| Actual Estimates/Historical Data | 2020-2025 |
| Forecast Period | 2026 - 2030 - 2035 |
| Market Representation | Revenue in USD Billion and CAGR from 2026 to 2030 |
| Segments Covered | Type, Restaurant Size, Consumer Preferences, Applications, End-User |
| Regional Scope | Asia-Pacific, Western Europe, Eastern Europe, North America, South America, Middle East, Africa |
| Country Scope | The countries covered in the report are Australia, Brazil, China, France, Germany, India, Indonesia, Japan, Taiwan, Russia, South Korea, UK, USA, Canada, Italy, Spain. |
| Key Companies Profiled | Genki Sushi Co. Ltd., RA Sushi Bar Restaurant LLC, Kura Sushi USA Inc., Hamazushi Co. Ltd., Nobu Hospitality LLC, Sushi-Tei Pte Ltd., Sushi Zushi LLC, Sushi Samba, Itacho Sushi, Morimoto Management LLC, Sushi Itto S.A. de C.V., Sakae Sushi, Blue Ribbon Restaurants, Sushi Nakazawa LLC, Akindo Sushiro Co. Ltd., Fuji Sushi Inc., Innovative Dining Group LLC, Pisces Sushi Bistro Inc., Sukiyabashi Jiro Co. Ltd., Wasabi Sushi Bento Limited |
| Customization Scope | Request for Customization |
| Pricing And Purchase Options | Explore Purchase Options |