
Energy and Utilities Analytics Market Report 2026
Global Outlook – By Type (Software, Services), By Deployment Mode (Cloud, On-Premises), By Application (Load Forecasting, Meter Operation, Distribution Planning, Demand Response, Other Applications) – Market Size, Trends, Strategies, and Forecast to 2035
Energy and Utilities Analytics Market Overview
• Energy and Utilities Analytics market size has reached to $3.82 billion in 2025 • Expected to grow to $8.16 billion in 2030 at a compound annual growth rate (CAGR) of 16.2% • Growth Driver: Smart Meter Deployment Drives Growth In The Energy And Utilities Analytics Market • Market Trend: Strategic Partnership Between Accelerates Sap Business Transformation In Energy And Utilities • North America was the largest region in 2025.Market Gains By 2030 – Top Opportunities By Segment
Market Gain identifies the most promising market opportunities by highlighting the segments or products expected to generate the highest incremental revenue growth over the next five years.
What Is Covered Under Energy and Utilities Analytics Market?
Energy and utility analytics refer to a process of combining the data from many sources and analyze it to make smart, data-driven decisions such as improving efficiency by optimizing supply chain and midstream costs. The primary use cases of the big data analytics in the energy and utilities sector are prediction, detection, and prevention of power outages. The main type of energy and utilities analytics is software and services. Software is a collection of instructions, data, or programs used to run machines and carry out specified activities. Software in energy and utilities analytics is a tool used for energy management, data analysis, or financial services. The deployment modes are cloud and on-premises, which are applied in load forecasting, meter operation, distribution planning, demand response, and others.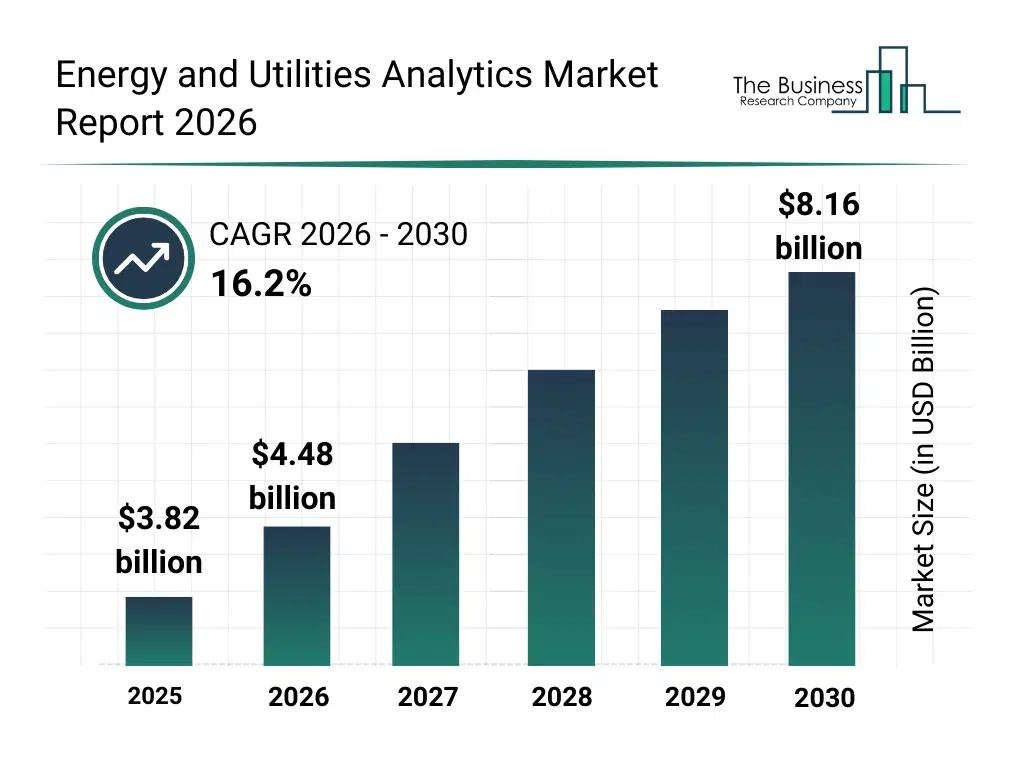
What Is The Energy and Utilities Analytics Market Size and Share 2026?
The energy and utilities analytics market size has grown rapidly in recent years. It will grow from $3.82 billion in 2025 to $4.48 billion in 2026 at a compound annual growth rate (CAGR) of 17.1%. The growth in the historic period can be attributed to expansion of smart grid infrastructure, rising deployment of smart meters, growing complexity of energy distribution networks, increasing need for operational efficiency, availability of big data platforms.What Is The Energy and Utilities Analytics Market Growth Forecast?
The energy and utilities analytics market size is expected to see rapid growth in the next few years. It will grow to $8.16 billion in 2030 at a compound annual growth rate (CAGR) of 16.2%. The growth in the forecast period can be attributed to increasing renewable energy integration, rising investments in digital utility transformation, expansion of AI-driven load forecasting, growing focus on grid resilience, increasing adoption of cloud-native analytics platforms. Major trends in the forecast period include increasing deployment of predictive analytics for grid operations, rising adoption of real-time energy data platforms, growing integration of advanced outage management systems, expansion of cloud-based utility analytics solutions, enhanced focus on demand forecasting accuracy.
Global Energy and Utilities Analytics Market Segmentation
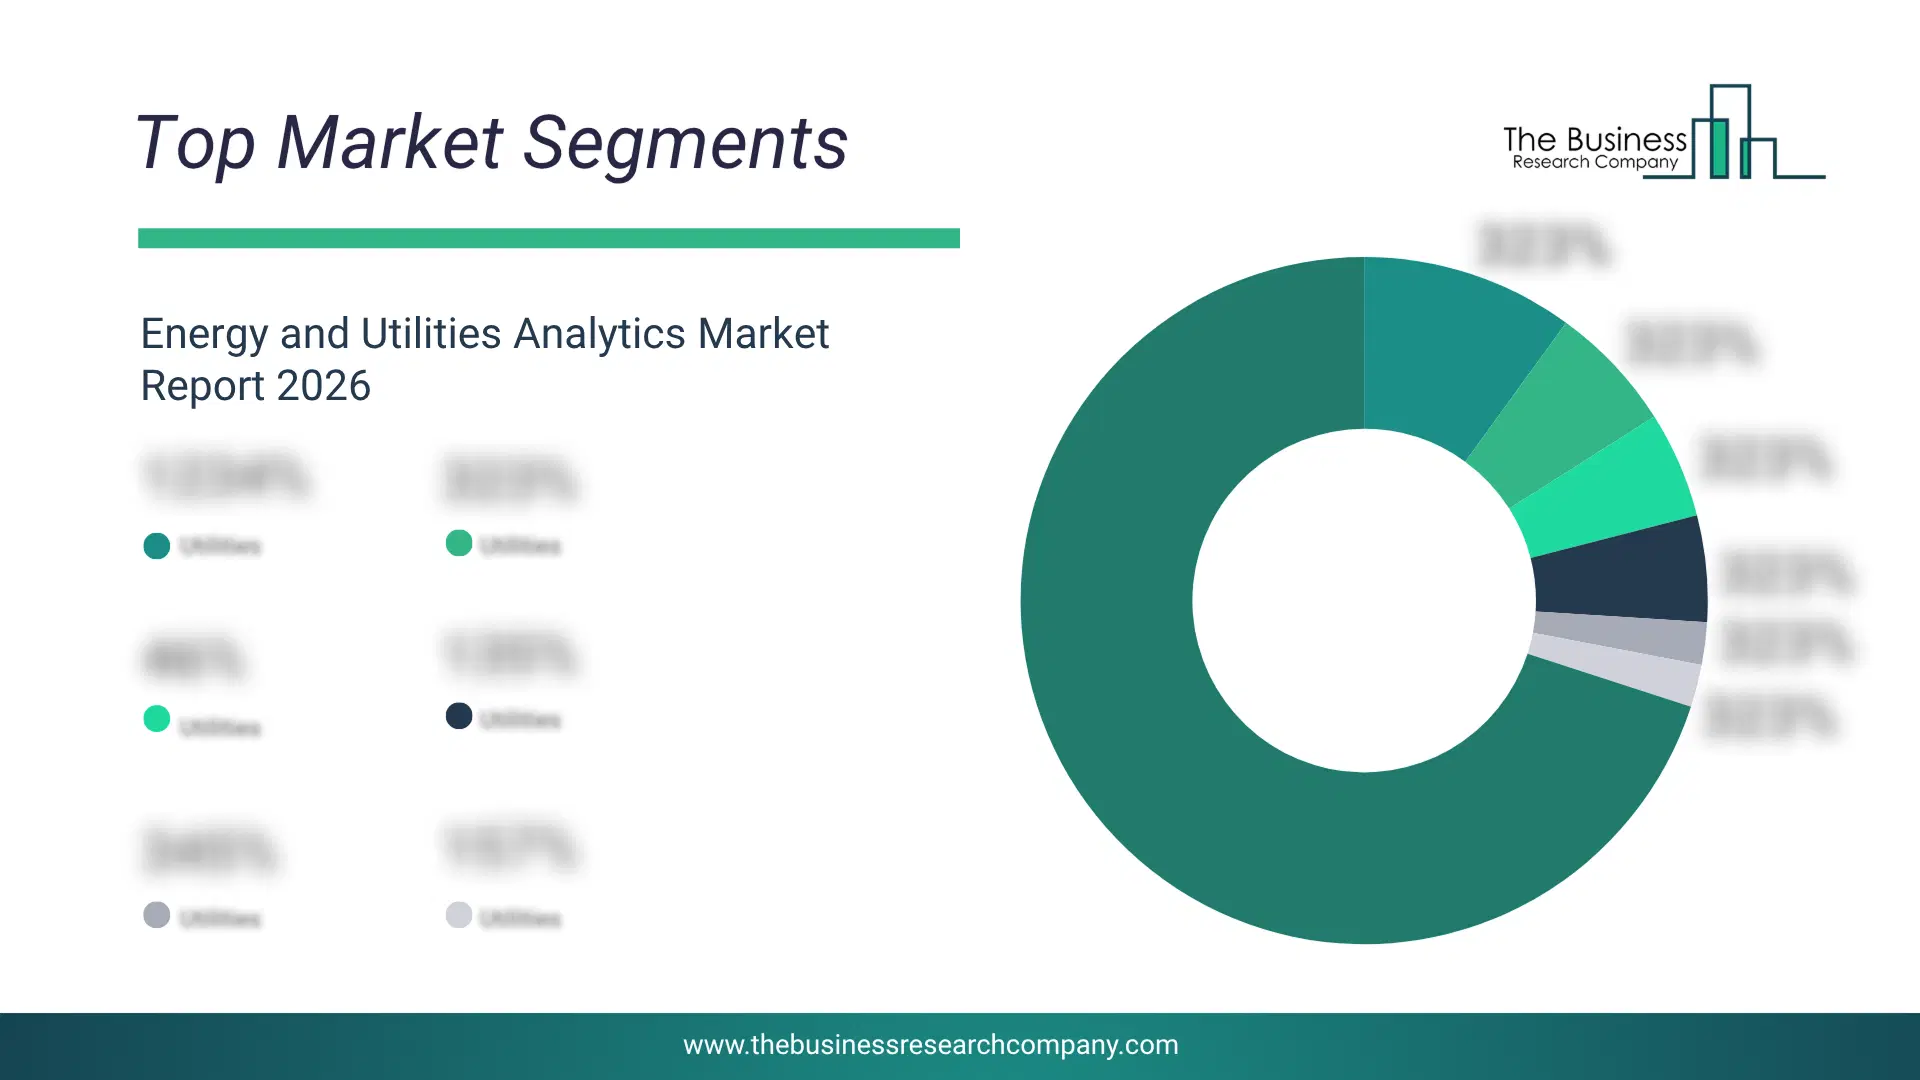
1) By Type: Software, Services 2) By Deployment Mode: Cloud, On-Premises 3) By Application: Load Forecasting, Meter Operation, Distribution Planning, Demand Response, Other Applications Subsegments: 1) By Software: Asset Management Software, Demand Forecasting Software, Energy Management Software, Data Visualization And Reporting Tools 2) By Services: Consulting Services, Implementation Services, Support And Maintenance Services, Training Services The top segments in the energy and utilities analytics market will be: • Software will reach $2577.3 Million by 2025. • On-Premises will reach $2024.9 Million by 2025. • Cloud will reach $1798 Million by 2025. • Services will reach $1245.6 Million by 2025. • Meter Operation will reach $1201.2 Million by 2025.What Is The Driver Of The Energy and Utilities Analytics Market?
The rising deployment of smart meters is expected to propel the energy and utilities analytics market growth. Smart meters detect electrical current flow and voltage at regular intervals and then sum the results to calculate the amount of power utilized. The rising deployment of smart meters increases power usage efficiency by introducing a bi-directional flow of information from the utilities to the consumer and vice-versa. Real-time data communication allows detecting outages, identifying power theft, avoiding meter data tampering, and provides better service. For instance, in August 2025, according to the Government of UK, a UK-based government body, large energy suppliers across Great Britain installed a total of 740,000 smart and advanced meters, marking a 3.3% increase compared to the previous quarter and representing the second consecutive quarterly growth in 2025. Therefore, the rising deployment of smart is driving the energy and utilities analytics industry.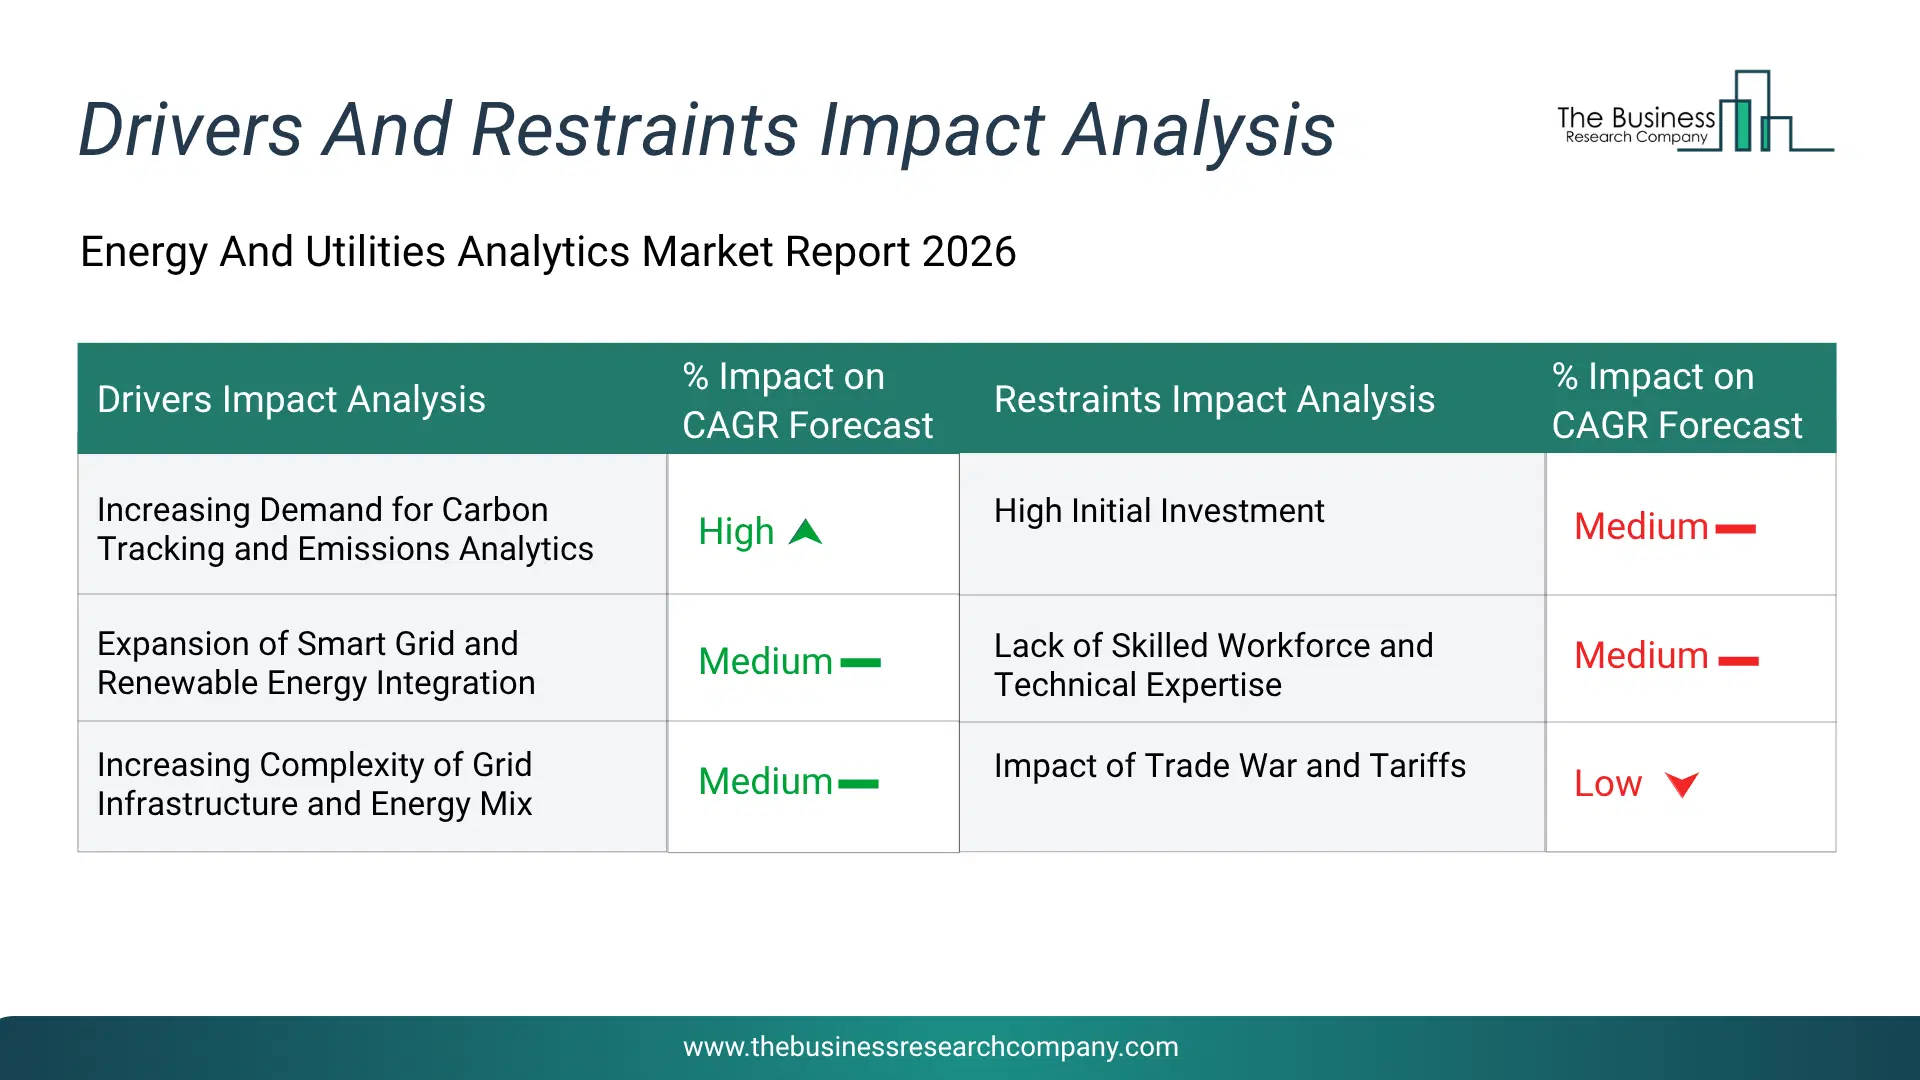
Infographic Chart Showing Key Market Drivers Analysis And Restraints For Energy And Utilities Analytics Market
The chart presents an impact analysis of key drivers and restraints, quantifying their relative influence on the market's growth rate and helping assess the balance between growth enablers and limiting factors. This chart offers a high-level perspective; the full report contains more detailed insights.
How Will The Drivers Impact Growth In The Global Energy And Utilities Analytics Market?
• Increasing Demand for Carbon Tracking and Emissions Analytics (High) – The increasing demand for carbon tracking and emissions analytics will become a key driver of growth in the energy and utilities analytics market by 2030. Organizations are under growing pressure to measure and reduce their carbon footprint due to regulations and sustainability goals. This has increased the need to track emissions across operations, supply chains, and energy consumption. Advanced analytics helps collect, process, and standardize emissions data from multiple sources. It enables accurate reporting, compliance management, and identification of reduction opportunities. Real-time insights support better decision-making for decarbonization strategies. As sustainability becomes a core priority, reliance on emissions-focused data analysis continues to grow. As a result, the increasing demand for carbon tracking and emissions analytics is anticipated to contributing to a 2.0% annual growth in the market. • Expansion of Smart Grid and Renewable Energy Integration (Medium) – The expansion of smart grid and renewable energy integration will become a significant driver contributing to the growth of the energy and utilities analytics market by 2030. The expansion of smart grids and integration of renewable energy sources are reshaping the energy landscape. These systems rely on interconnected devices, sensors, and communication networks that generate continuous streams of data. Analytics is essential to process this data and ensure efficient grid operation. It helps forecast renewable generation, which can be variable and weather-dependent. This allows better balancing of supply and demand in real time. It also improves fault detection, response times, and overall grid reliability. Enhanced visibility supports better decision-making and energy distribution. As adoption rises, data-driven intelligence becomes a core component of modern grid management. Consequently, the expansion of smart grid and renewable energy integration is projected to contributing to a 0.8% annual growth in the market. • Increasing Complexity of Grid Infrastructure and Energy Mix (Medium) – The increasing complexity of grid infrastructure and energy mix will serve as a key growth catalyst for the energy and utilities analytics market by 2030. Modern power systems are becoming increasingly complex with the addition of renewable energy, distributed generation, and bidirectional energy flows. This complexity makes it difficult to manage grid stability using traditional methods. Advanced analytics provides real-time visibility into grid performance and energy flows. It helps identify potential disruptions, congestion points, and inefficiencies. Utilities can optimize operations and ensure consistent power delivery. Data-driven models also support better forecasting and contingency planning. Coordinating multiple energy sources requires continuous monitoring and analysis. As complexity grows, reliance on sophisticated analytical solutions increases significantly. Therefore, this increasing complexity of grid infrastructure and energy mix is projected to supporting to a 1.3% annual growth in the market. • Expansion of Energy Storage Systems (Low) – The expansion of energy storage systems will emerge as a major factor driving the expansion of the energy and utilities analytics market by 2030. The rapid growth of energy storage systems, especially battery storage, is transforming how electricity is managed. These systems generate large volumes of operational data related to charging, discharging, and performance. Analytics helps optimize energy storage usage by predicting demand patterns and improving cycle efficiency. It also supports grid balancing by storing excess energy and releasing it when needed. Predictive maintenance reduces system failures and extends asset life. Integration with renewable sources further increases the need for intelligent data analysis. Real-time insights enhance reliability and operational efficiency. Consequently, the expansion of energy storage systems is projected to contributing to a 1.5% annual growth in the market.How Will The Restraints Impact Growth In The Global Energy And Utilities Analytics Market?
• High Initial Investment (High) – High initial investment is expected to restrain market growth during the forecast period. It creates operational, financial, regulatory, or commercial challenges that can increase costs, delay projects, reduce investments, or discourage purchasing decisions depending on the market. These challenges can reduce product adoption, affect business confidence, and limit the ability of companies to expand efficiently across key regions. This can disrupt long-term growth strategies and reduce the ability of companies to capitalize on emerging market opportunities. • Lack of Skilled Workforce and Technical Expertise (Medium) – During the forecast period, lack of skilled workforce and technical expertise is likely to limit market expansion. It creates operational, financial, regulatory, or commercial challenges that can increase costs, delay projects, reduce investments, or discourage purchasing decisions depending on the market. These challenges can reduce product adoption, affect business confidence, and limit the ability of companies to expand efficiently across key regions. As a result, organizations may postpone purchasing decisions, limiting demand across both established and emerging markets. • Impact of Trade War and Tariffs (Medium) – The market is expected to face challenges due to impact of trade war and tariffs over the forecast period. It creates operational, financial, regulatory, or commercial challenges that can increase costs, delay projects, reduce investments, or discourage purchasing decisions depending on the market. These challenges can reduce product adoption, affect business confidence, and limit the ability of companies to expand efficiently across key regions. This may reduce production efficiency, extend project timelines, and create challenges in meeting evolving customer requirements.Key Players In The Global Energy and Utilities Analytics Market
Major companies operating in the energy and utilities analytics market are Eaton Corporation; International Business Machines Corporation (IBM); SAP SE; General Electric; Schneider Electric; Siemens AG; Oracle Corporation; SAS Institute; Teradata Corporation; TIBCO Software; Honeywell International Inc; Capgemini SE; ABB Limited; Hitachi Ltd; Siemens Energy AG; Wipro Limited; Infosys Limited; Accenture plc; Fluentgrid Limited; Seeq Corporation; Volue ASA; PSI Software SE; Itron Inc; AutoGrid Systems Inc; EnergyHub Inc; Innowatts Inc.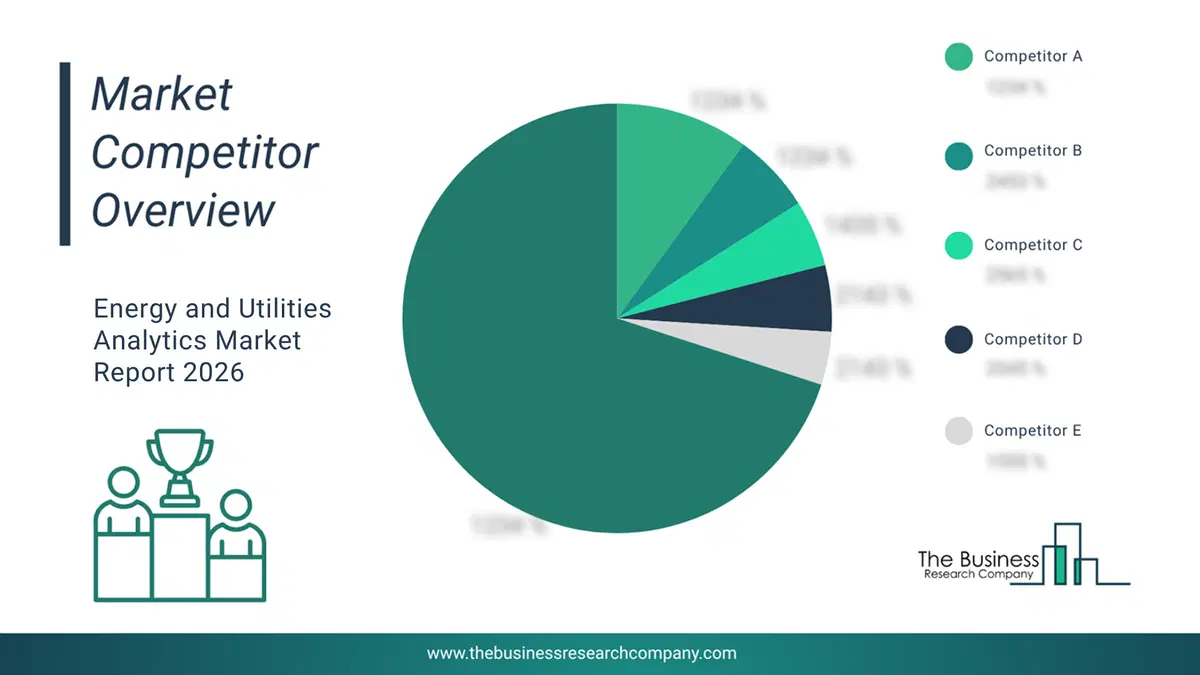
This chart is for illustrative purposes; the full report includes a detailed competitor analysis and comprehensive overview of the top 10 companies in the market.
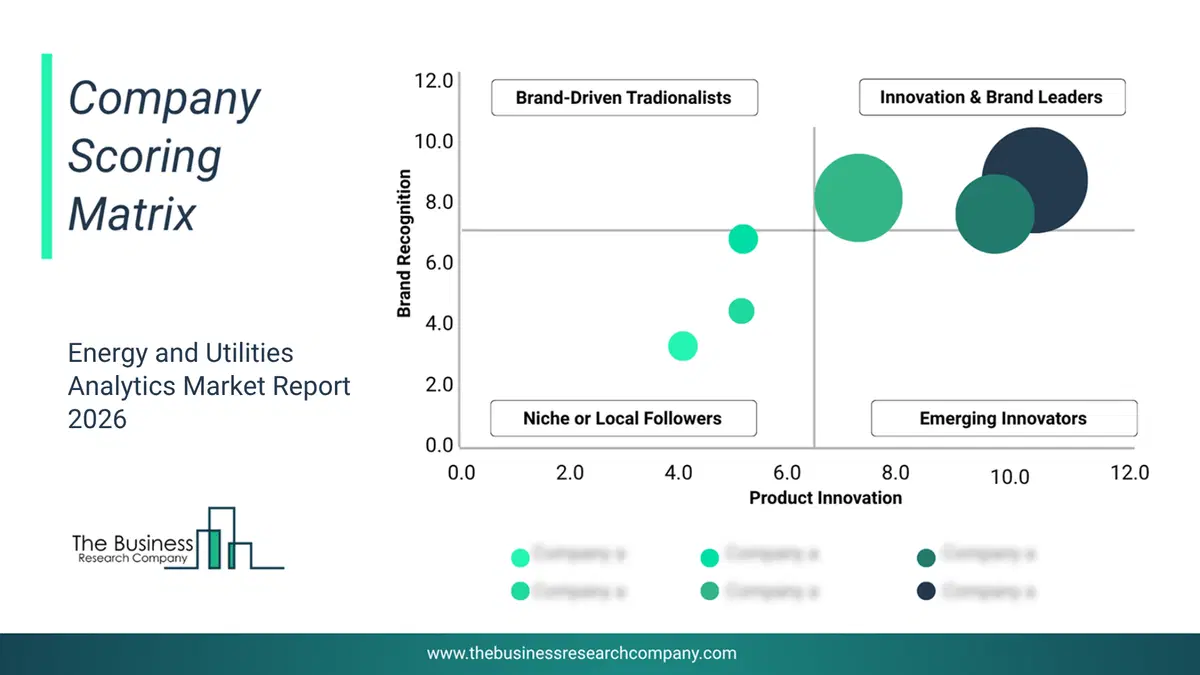
This chart maps companies by product innovation and brand strength, with bubble size indicating relative revenue, helping identify market leaders, challengers, and niche players. This is an illustrative chart; the full report provides a complete and accurate competitive analysis.
Global Energy and Utilities Analytics Market Trends and Insights
Major companies operating in the energy and utilities analytics market are adopting a strategic partnership approach aiming to provide revolutionary SAP business transformation in energy and utilities. Strategic partnerships refer to a process in which companies leverage each other's strengths and resources to achieve mutual benefits and success. For instance, in October 2023, the International Business Machines Corporation, a US-based technological company, announced a partnership expansion with KPMG LLP to assist clients deploying SAP S/4HANA in the energy and utility industries in enabling business changes. KPMG and IBM Consulting combine complementary skill sets in the areas of SAP technology deployment, cross-industry operations, governing, risk, finance, and tax concerns, and operational difficulties. The organizations' combined capabilities and experience may improve client outcomes and enable effective business resource planning transformation throughout the energy and utility sectors. KPMG LLP is a US-based independent professional services business that provides audit, tax, and consulting services.What Are Latest Mergers And Acquisitions In The Energy and Utilities Analytics Market?
In September 2023, Tata Power Delhi Distribution Limited, an India-based provider of electricity distribution services, partnered with Utilityx Inc. to enhance cyber security and real-time analytics for its distribution grid. Through this collaboration, Tata Power Delhi Distribution Limited aims to strengthen its capabilities in detecting and neutralizing cyber threats, improving grid visibility, and enabling real-time decision-making. Utilityx Inc. is a US-based provider of energy and utilities analytics.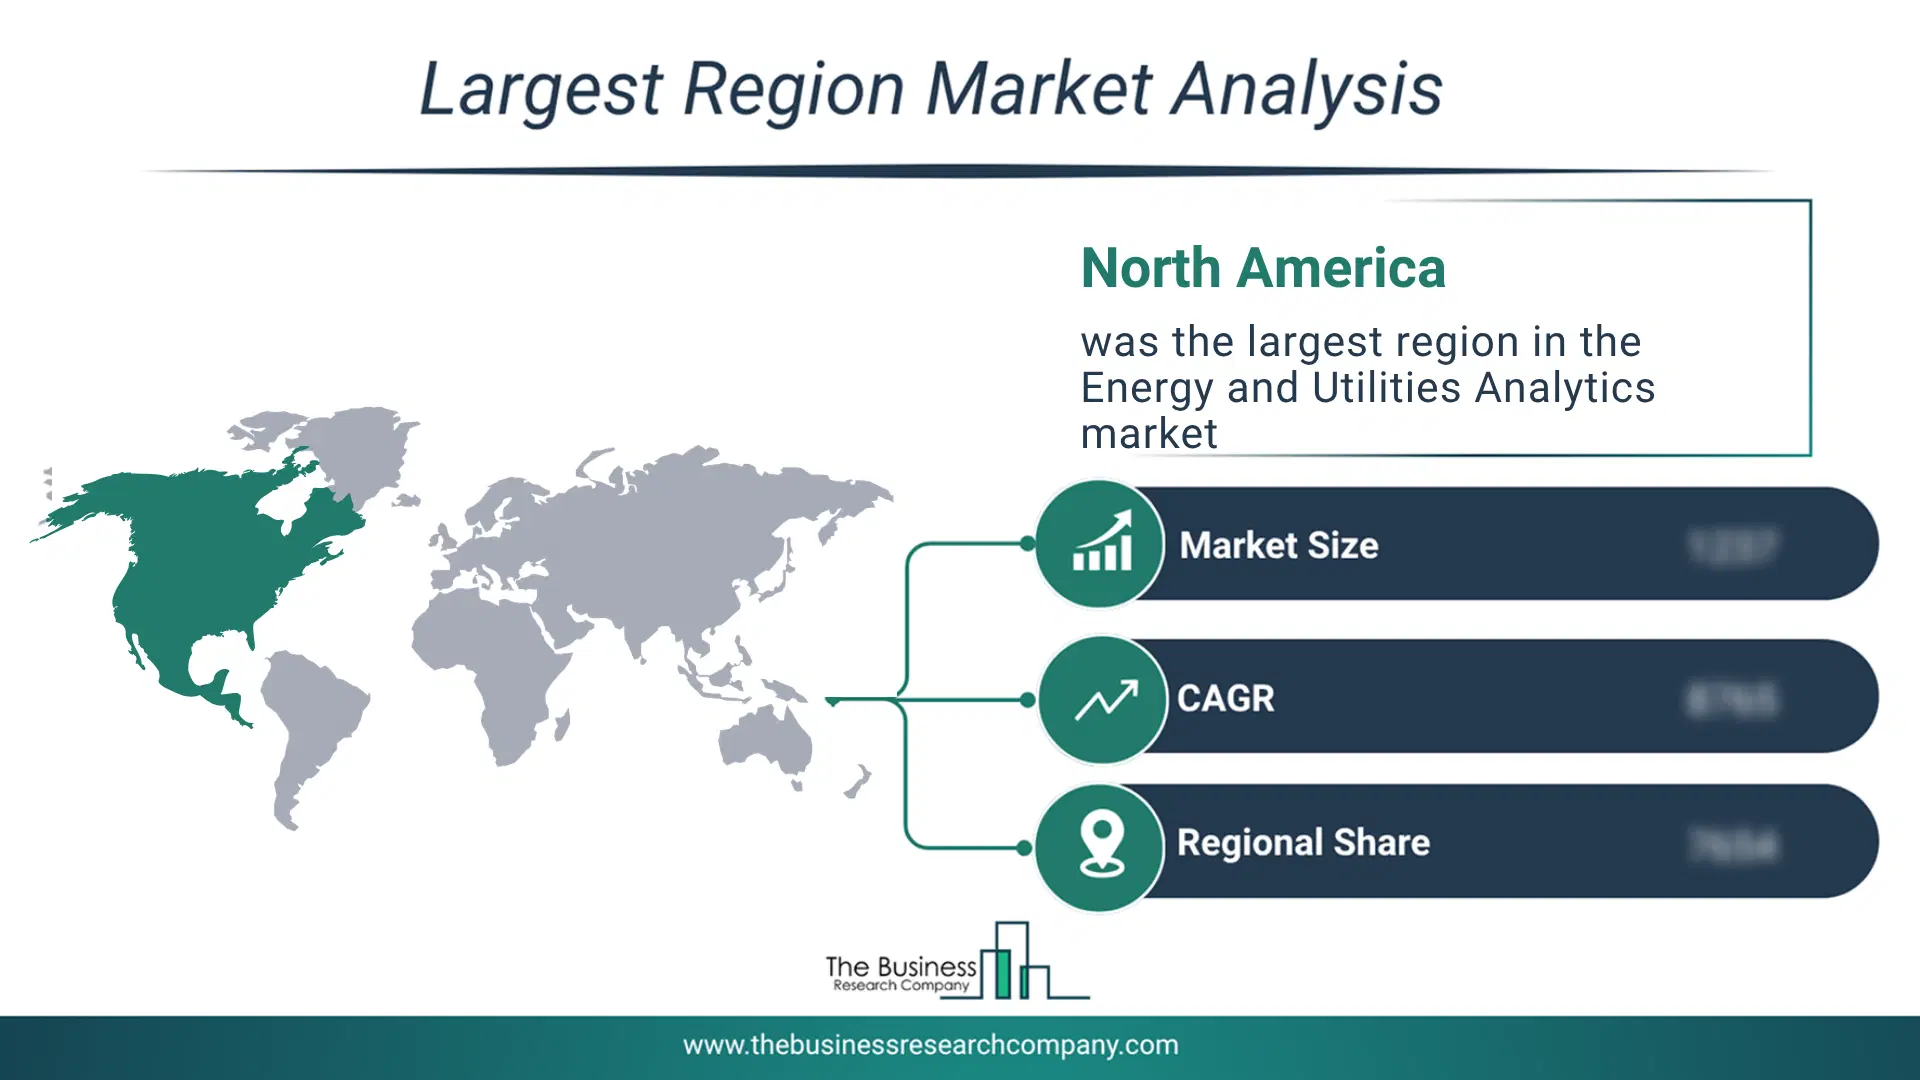
Regional Insights
North America was the largest region in the energy and utilities analytics market share in 2025. The regions covered in this market report are Asia-Pacific, South East Asia, Western Europe, Eastern Europe, North America, South America, Middle East, Africa. The countries covered in this market report are Australia, Brazil, China, France, Germany, India, Indonesia, Japan, Taiwan, Russia, South Korea, UK, USA, Canada, Italy, SpainWhat Defines the Energy and Utilities Analytics Market?
The energy and utilities analytics market include revenues earned by entities by analyzing real-time data management, bill management, auditing and tracking bill, customer analytics. The market value includes the value of related goods sold by the service provider or included within the service offering. Only goods and services traded between entities or sold to end consumers are included.How is Market Value Defined and Measured?
The market value is defined as the revenues that enterprises gain from the sale of goods and/or services within the specified market and geography through sales, grants, or donations in terms of the currency (in USD unless otherwise specified). The revenues for a specified geography are consumption values that are revenues generated by organizations in the specified geography within the market, irrespective of where they are produced. It does not include revenues from resales along the supply chain, either further along the supply chain or as part of other products.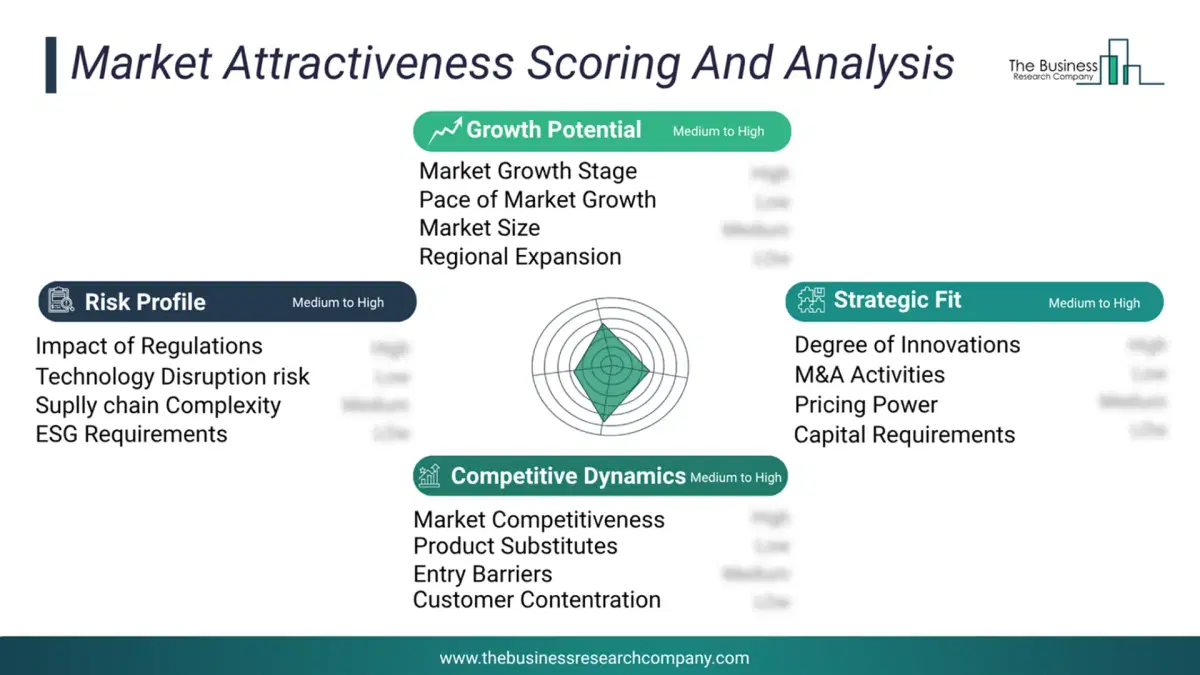
This chart presents market attractiveness based on a quantitative evaluation of growth, competition, strategic alignment, and risk, offering a clear view of opportunity areas for decision-making. This chart is for illustrative purposes; the full report contains the complete analysis.
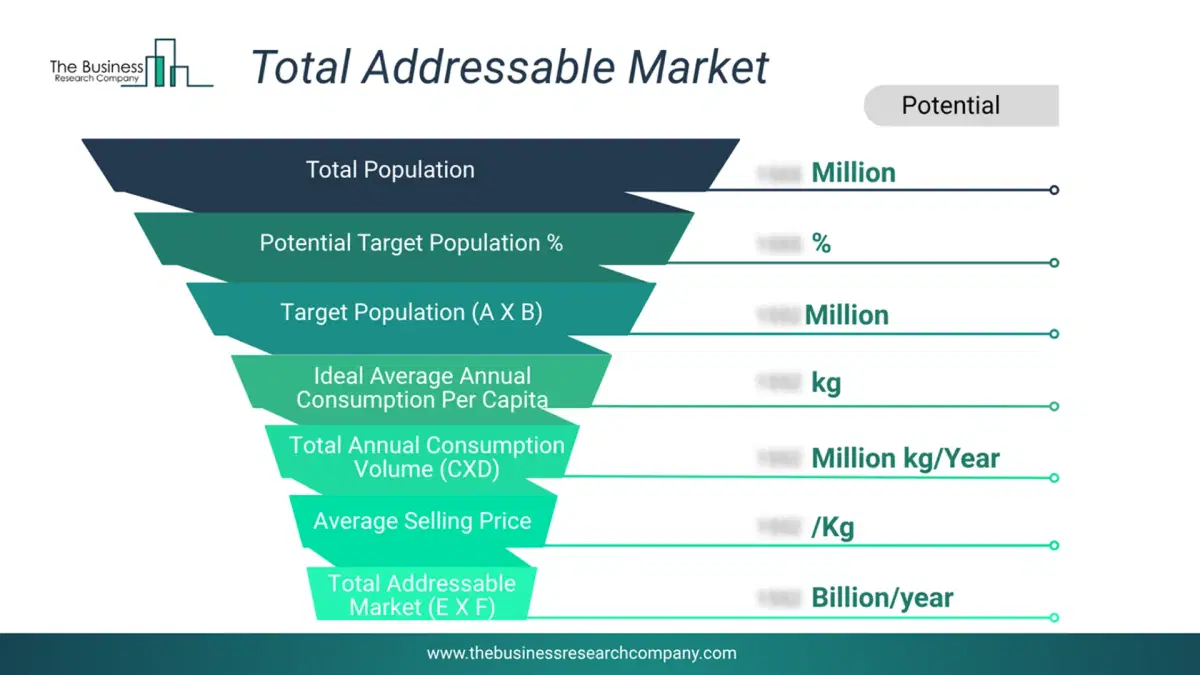
This chart highlights the Total Addressable Market (TAM) by estimating the maximum revenue opportunity using an assumption-driven approach, supporting strategic planning and opportunity sizing across markets. The chart is illustrative; the full report provides a more comprehensive analysis.
What Key Data and Analysis Are Included in the Energy and Utilities Analytics Market Report 2026?
The energy and utilities analytics market research report is one of a series of new reports from The Business Research Company that provides market statistics, including industry global market size, regional shares, competitors with the market share, detailed market segments, market trends and opportunities, and any further data you may need to thrive in the energy and utilities analytics industry. The market research report delivers a complete perspective of everything you need, with an in-depth analysis of the current and future state of the industry.Energy and Utilities Analytics Market Report Forecast Analysis
| Report Attribute | Details |
|---|---|
| Market Size Value In 2026 | $4.48 billion |
| Revenue Forecast In 2035 | $8.16 billion |
| Growth Rate | CAGR of 17.1% from 2026 to 2035 |
| Base Year For Estimation | 2025 |
| Actual Estimates/Historical Data | 2020-2025 |
| Forecast Period | 2026 - 2030 - 2035 |
| Market Representation | Revenue in USD Billion and CAGR from 2026 to 2035 |
| Segments Covered | Type, Deployment Mode, Application |
| Regional Scope | Asia-Pacific, Western Europe, Eastern Europe, North America, South America, Middle East, Africa |
| Country Scope | The countries covered in the report are Australia, Brazil, China, France, Germany, India, ... |
| Key Companies Profiled | Eaton Corporation; International Business Machines Corporation (IBM); SAP SE; General Electric; Schneider Electric; Siemens AG; Oracle Corporation; SAS Institute; Teradata Corporation; TIBCO Software; Honeywell International Inc; Capgemini SE; ABB Limited; Hitachi Ltd; Siemens Energy AG; Wipro Limited; Infosys Limited; Accenture plc; Fluentgrid Limited; Seeq Corporation; Volue ASA; PSI Software SE; Itron Inc; AutoGrid Systems Inc; EnergyHub Inc; Innowatts Inc. |
| Customization Scope | Request for Customization |
| Pricing And Purchase Options | Explore Purchase Options |